AAPL
weekly
S: $$230 / R: $$258
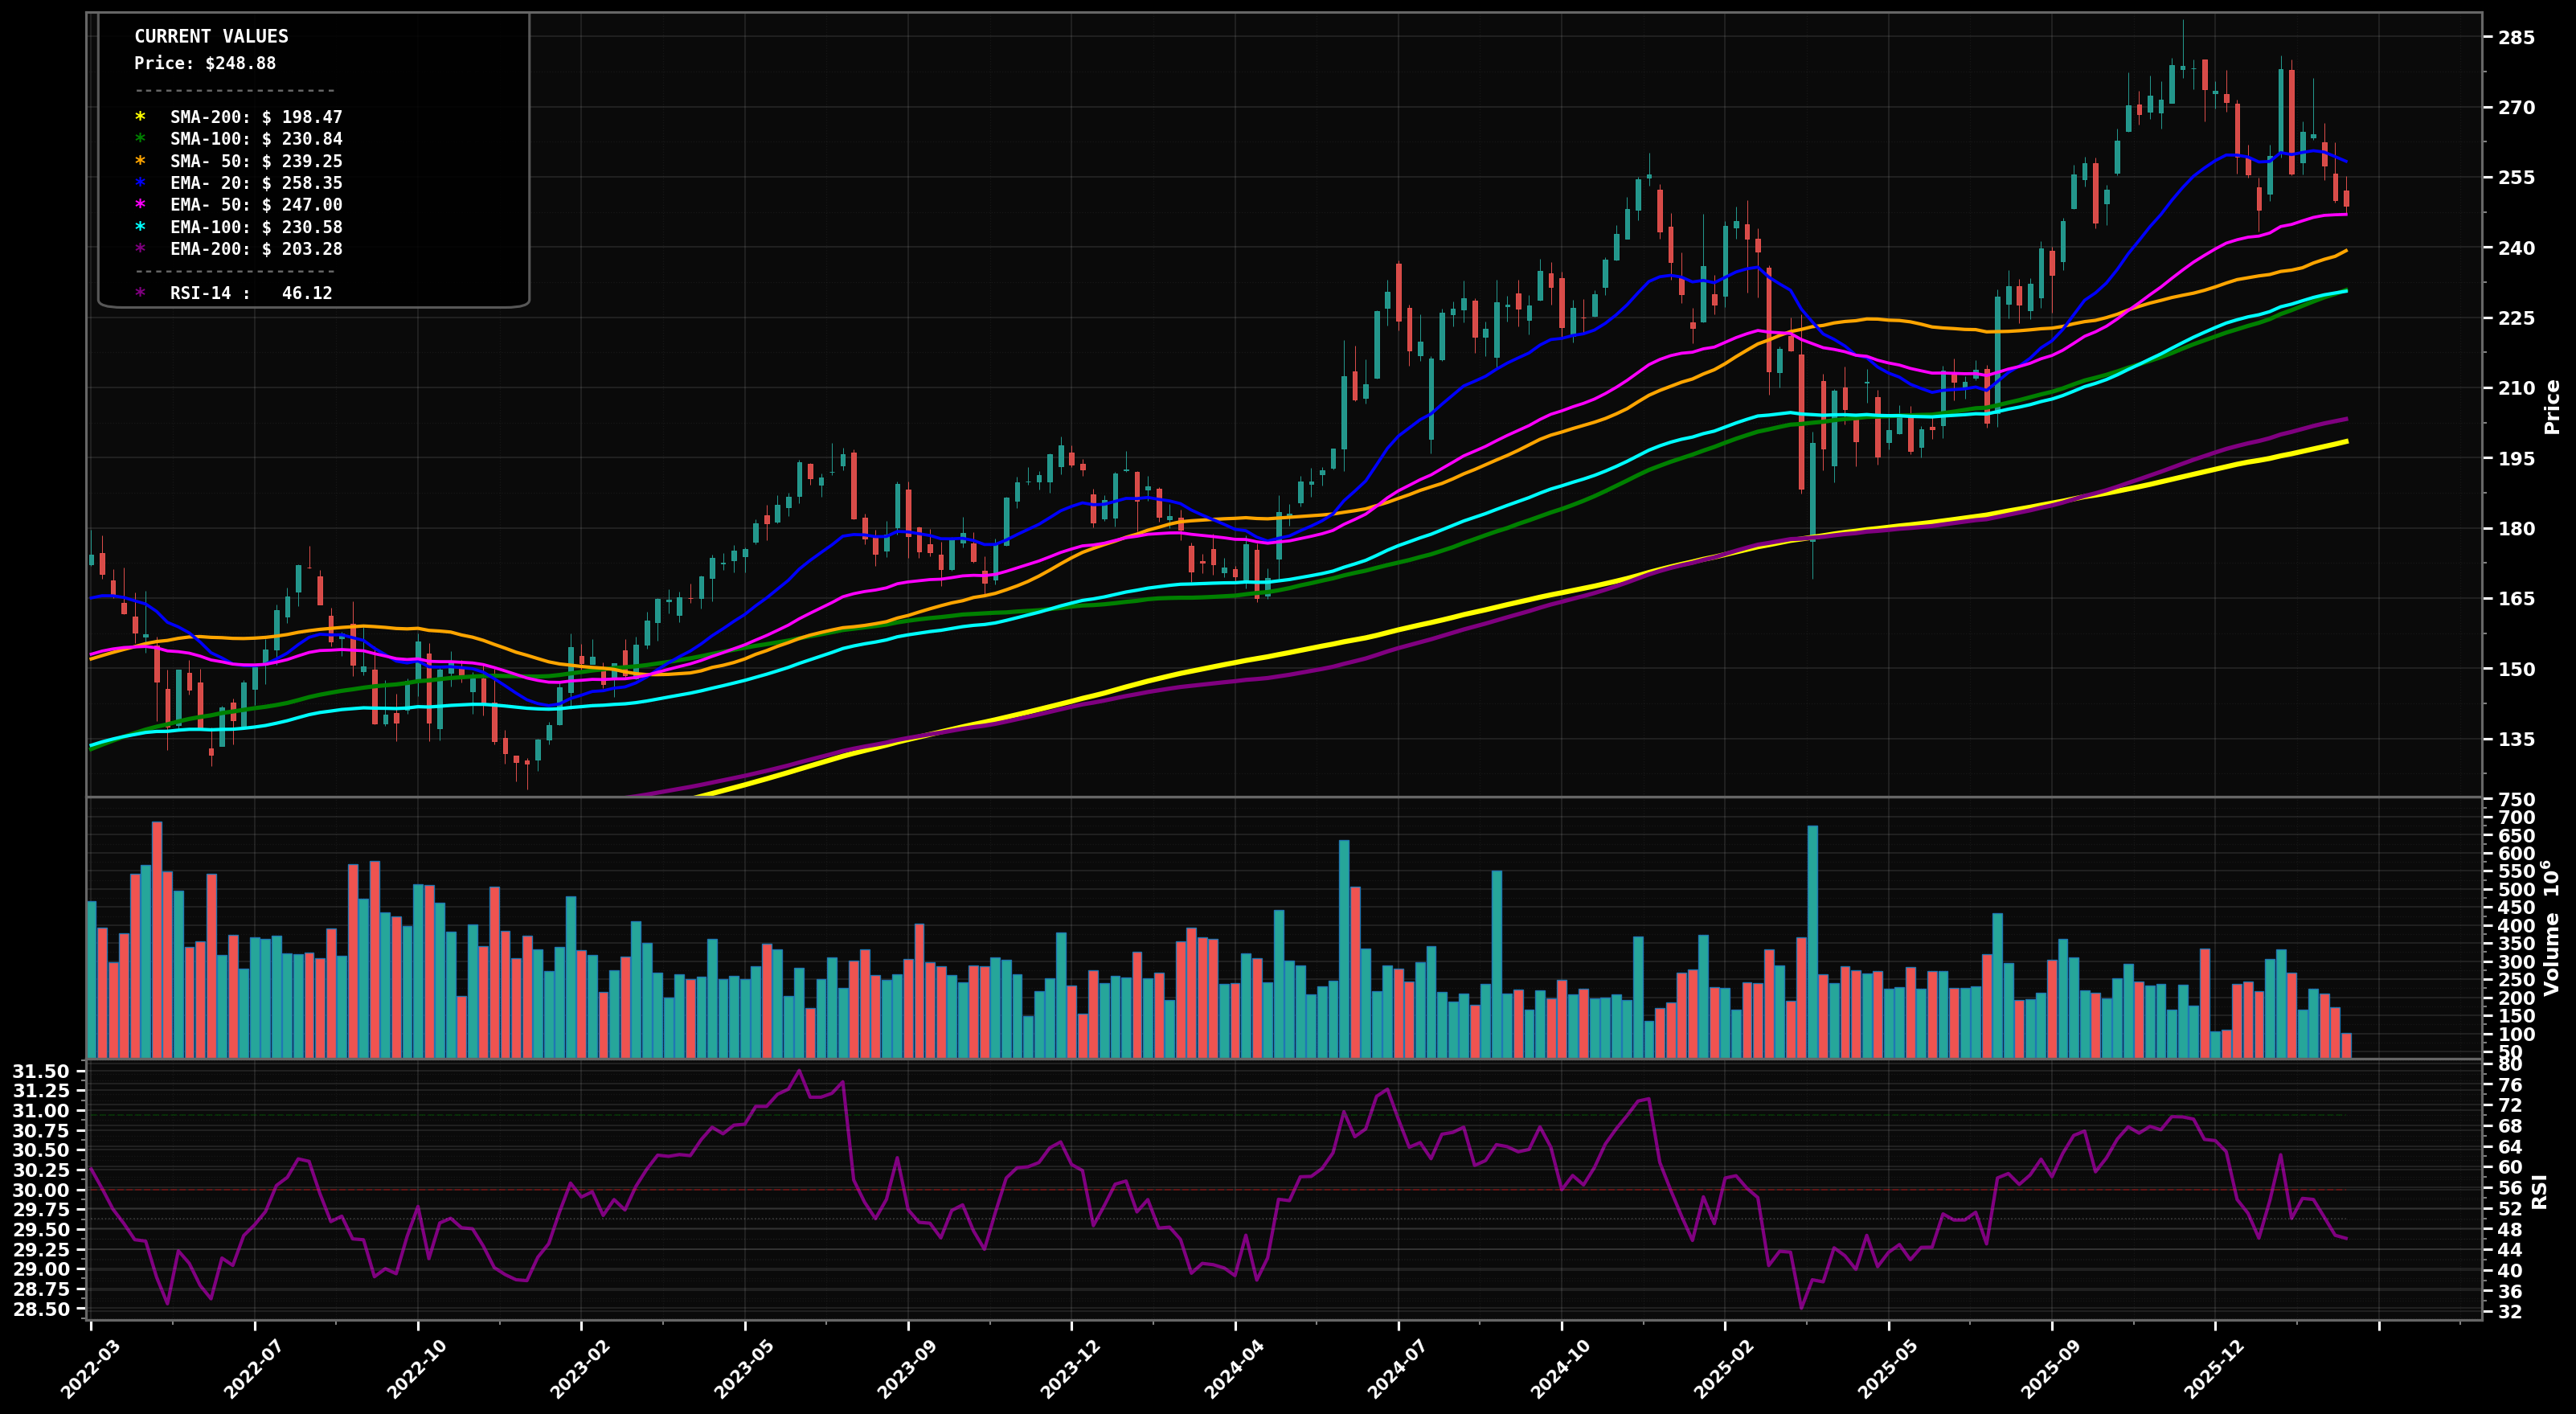
CHOPPY RANGE
Weekly pullback from the ~$280s into the $245-$250 area; price now below EMA50 (pink) but still above EMA100 (cyan) and well above EMA200 (purple); RSI ~46 (cooling, not oversold).
62
Key Triggers
- Overlapping weekly candles after the ~$280 peak with sharp whips (no clean HH/HL sequence)
- Price oscillating around fast MAs: below EMA50 (~$246.97) but above EMA100 (~$230.57)
- Momentum reset: RSI-14 ~45.8 suggests consolidation rather than trend acceleration
✓ Confirmation
2 weekly closes above $258 (reclaim and hold above the near-term MA cluster / prior breakdown zone).
✗ Invalidation
Weekly close below $230 (loss of EMA100 area and range support).
bullish
Scenario 1 (Most Likely)
Base-building between $230-$258, then reclaim of EMA50/near-term structure and retest of the prior highs; this would look like a Wave (4) consolidation resolving into a Wave (5) attempt.
Target 1
$$258
Target 2
$$280
Revert
$$246
bearish
Scenario 2
Breakdown through the $230 area (EMA100) triggers a deeper weekly correction toward the thicker long-term supports; could be a larger ABC/Wave (4) morphing into a more complex correction.
Target 1
$$214
Target 2
$$198
Revert
$$230
⊕ Add
Start
$$232 – $$240
Add
$$214 – $$226
Heavy
$$198 – $$206
Start near EMA100/support shelf ($230s); add on breakdown-retest into next demand pocket (~$214); heavy add near SMA200 (~$198) where long-term trend support typically attracts buyers.
⊖ Derisk
Trim 1
$$278 – $$285
Trim 2
$$300 – $$315
Close
$$335 – $$360
Trim into prior peak/upper range resistance (~$280s); more trimming on an extended Wave (5)-type push ($300+); close if price becomes multi-year stretched well above long MAs and prior cycle highs ($335-$360).
Want the thesis behind this chart?
Get the full analysis — why we're watching AAPL, how it fits in a real portfolio, and the conviction level behind the trade.