AAPL
monthly
S: $$225 / R: $$260
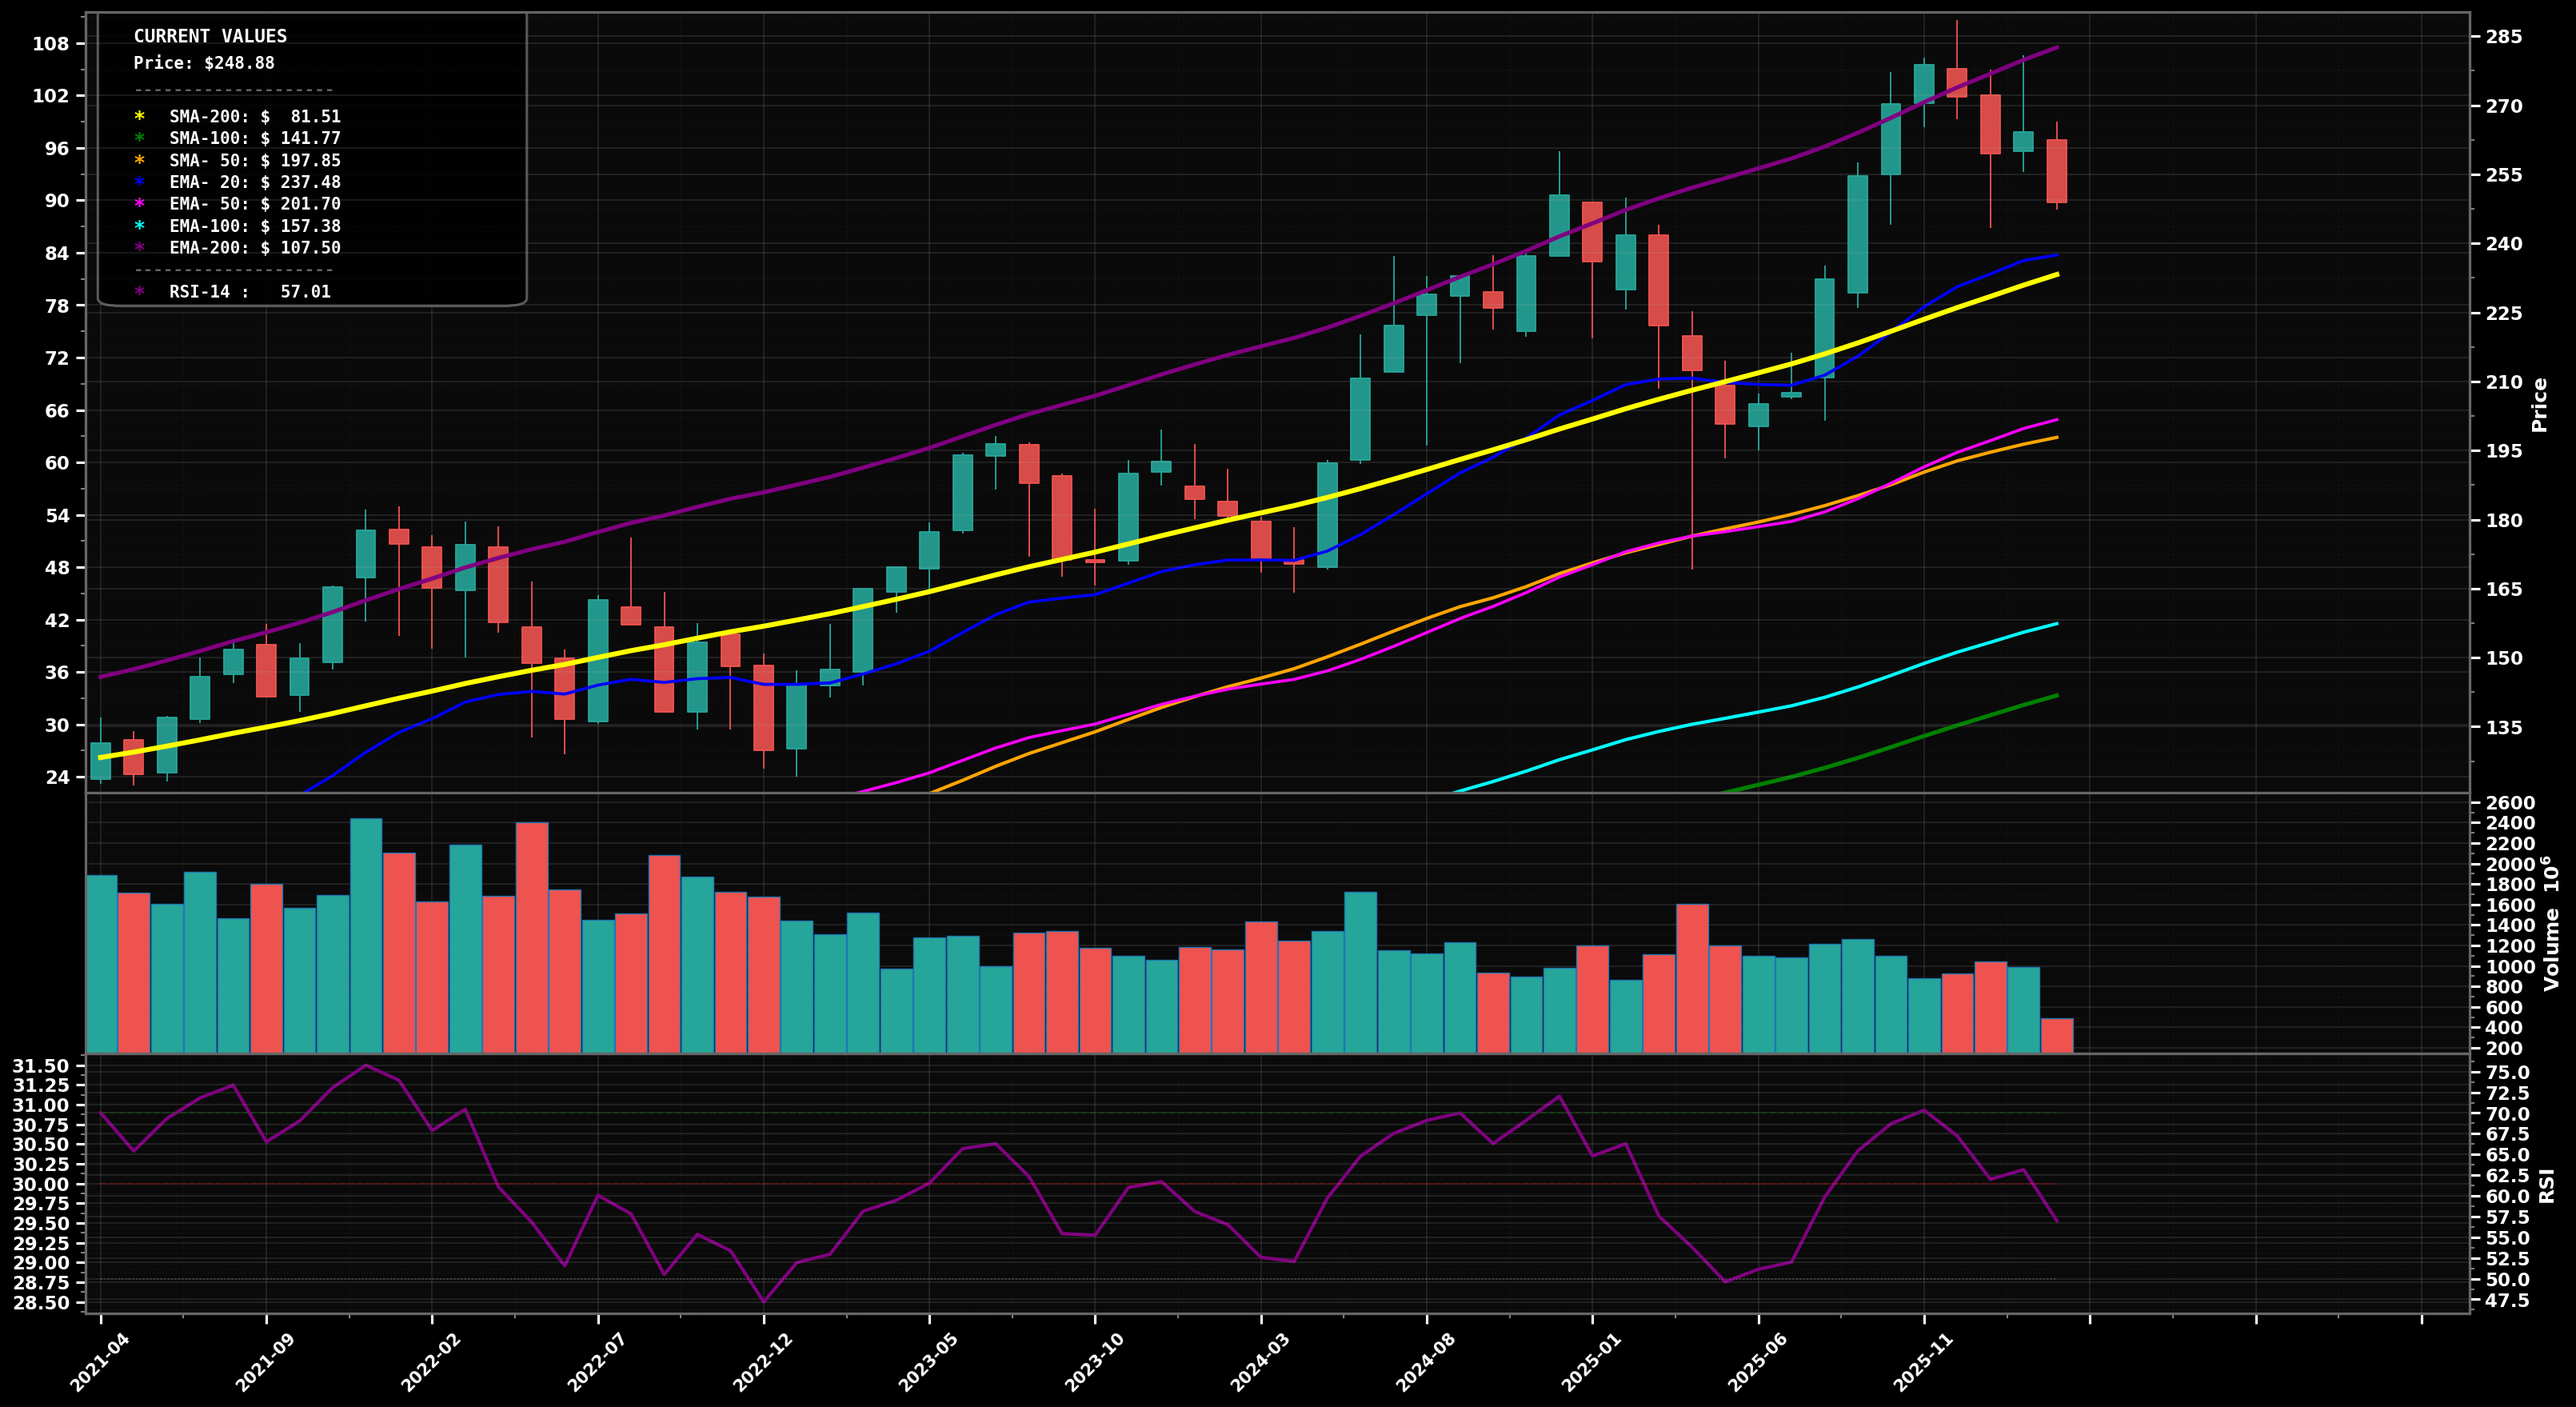
UPTREND
Monthly uptrend structure remains, but last 2-3 candles show a pullback from the recent ~$280 peak; price (~$248) is still above key longer MAs while below the rising EMA200 (purple).
62
Key Triggers
- Swing structure still broadly HH/HL since 2023 with price holding well above EMA50 (pink) and EMA100 (cyan)
- EMA50 (pink) and EMA100 (cyan) are rising and stacked bullishly vs EMA200
- Pullback looks corrective so far (no confirmed LL on monthly)
✓ Confirmation
Monthly close back above ~$260 would confirm trend continuation from the pullback
✗ Invalidation
Monthly close below ~$225 would break the prior swing-low area and put the uptrend at risk
bullish
Scenario 1 (Most Likely)
Base/pullback resolves higher: price holds the ~$235–$225 demand zone, then reclaims ~$260 and retests the prior highs near ~$280 (trend continuation).
Target 1
$$260
Target 2
$$280
Revert
$$235
bearish
Scenario 2
Deeper correction: failure to reclaim ~$260 leads to a monthly breakdown under ~$225, targeting the confluence band near the rising long-term averages (SMA50/EMA50 area) and prior breakout region.
Target 1
$$210
Target 2
$$198
Revert
$$235
⊕ Add
Start
$$232 – $$225
Add
$$212 – $$205
Heavy
$$200 – $$185
Start near prior pivot/support and mid-range retrace; add into ~$210 area (SMA200 yellow/structure) if weakness continues; heavy add only on a deeper monthly retrace toward the pre-breakout base/major fib confluence.
⊖ Derisk
Trim 1
$$280 – $$300
Trim 2
$$300 – $$330
Close
$$330 – $$380
Trim into prior ATH/extension zones where wave-5 style exhaustion risk rises; heavier trims on multi-year extension beyond prior cycle highs; full close only if price becomes extremely stretched vs long MAs.
Want the thesis behind this chart?
Get the full analysis — why we're watching AAPL, how it fits in a real portfolio, and the conviction level behind the trade.