AAPL
daily
S: $$246.60 / R: $$261.50
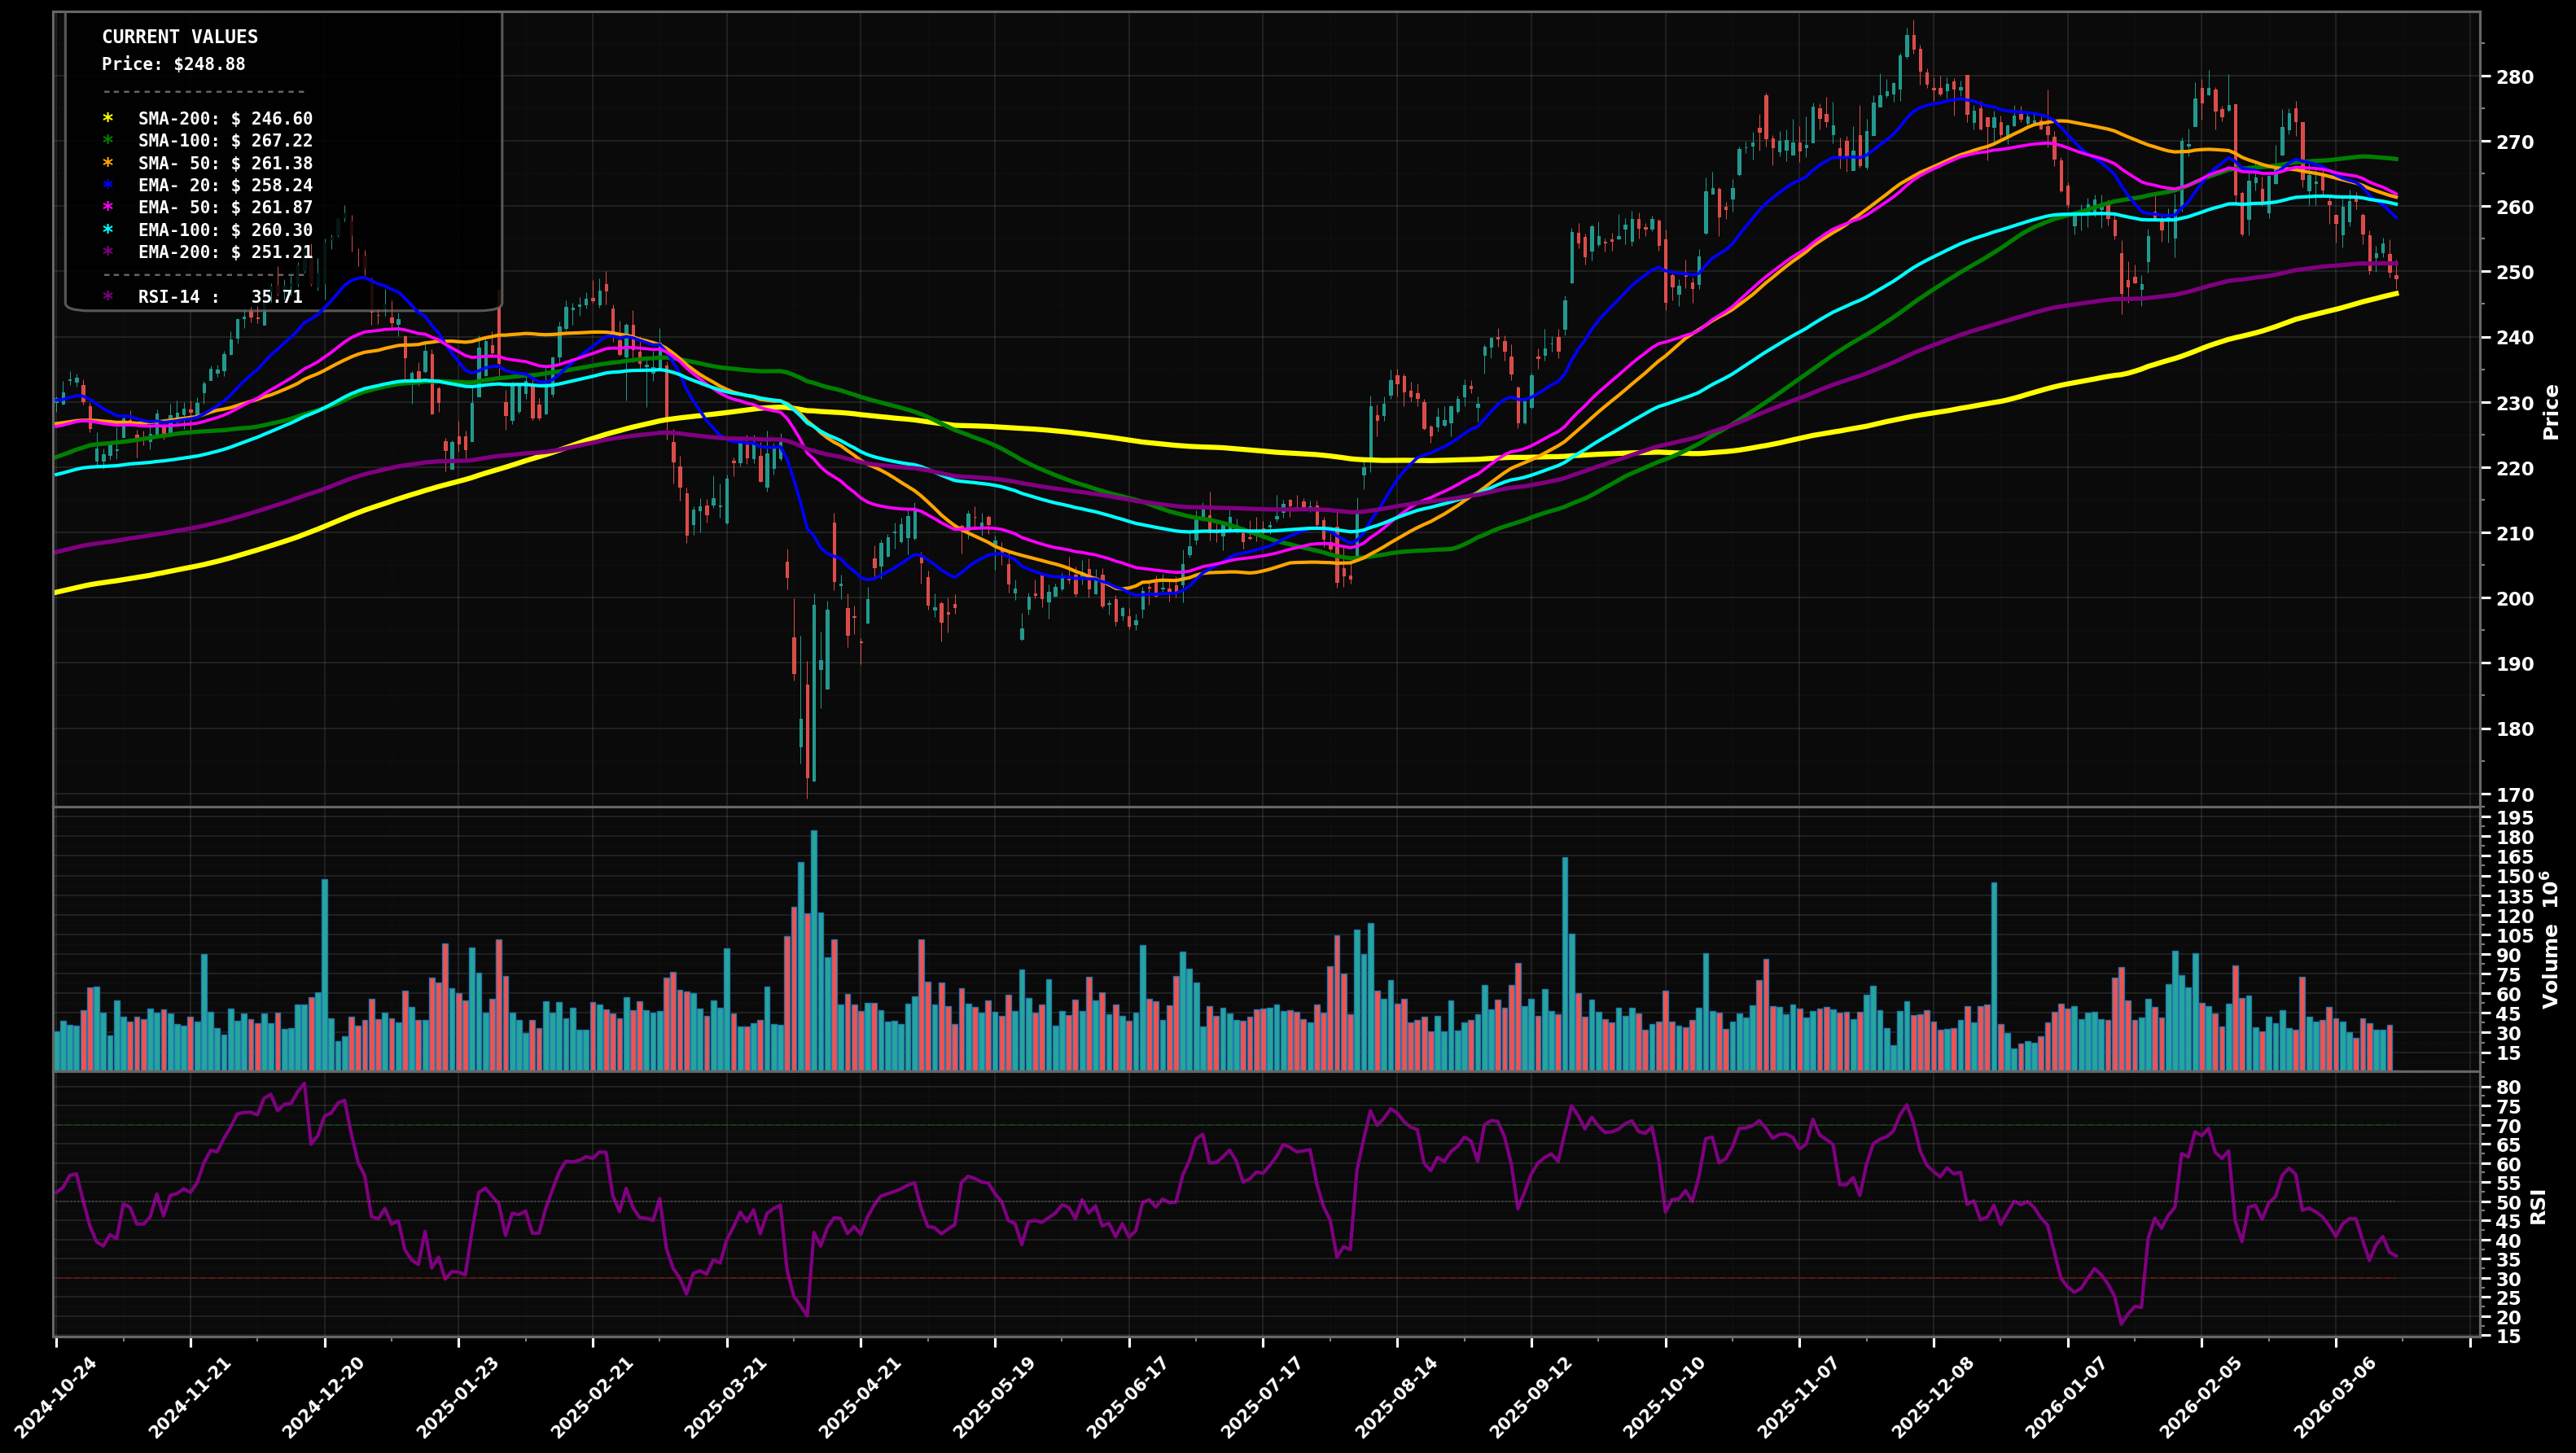
DOWNTREND
Price (~$248) sold down into the rising SMA200/EMA200 area after a sequence of LHs from the ~$280 peak; momentum weak (RSI ~35).
68
Key Triggers
- Swing structure shows LH/LL since the ~$280 top
- Price is below EMA50 (pink) and EMA100 (cyan) with EMA50 rolling over
- Multiple MAs above price ($258–$267) acting as overhead supply
✓ Confirmation
Daily close below $246 (SMA200) with follow-through
✗ Invalidation
2+ daily closes back above $262 (EMA50/SMA50 zone)
bullish
Scenario 1 (Most Likely)
Support hold at the $246 SMA200/EMA200 confluence, followed by a relief bounce that retests the broken MA cluster (typical Wave (B)/(2) retrace).
Target 1
$$258.20
Target 2
$$267.20
Revert
$$252.00
bearish
Scenario 2
Breakdown below the $246 long-term support triggers another leg lower (potential Wave (C)/(3) extension) before any durable base forms.
Target 1
$$238.00
Target 2
$$225.00
Revert
$$246.00
⊕ Add
Start
$$244.00 – $$248.50
Add
$$238.00 – $$242.00
Heavy
$$224.00 – $$232.00
Start at SMA200/EMA200 confluence; add on confirmed breakdown/retest; heavy add near next higher-timeframe demand (prior base area) if capitulation prints.
⊖ Derisk
Trim 1
$$270.00 – $$276.00
Trim 2
$$282.00 – $$290.00
Close
$$300.00 – $$315.00
Trim into prior supply and potential fib retrace into the old highs; fully close only on a major extension well above the prior peak (parabolic risk/mean reversion).
Want the thesis behind this chart?
Get the full analysis — why we're watching AAPL, how it fits in a real portfolio, and the conviction level behind the trade.