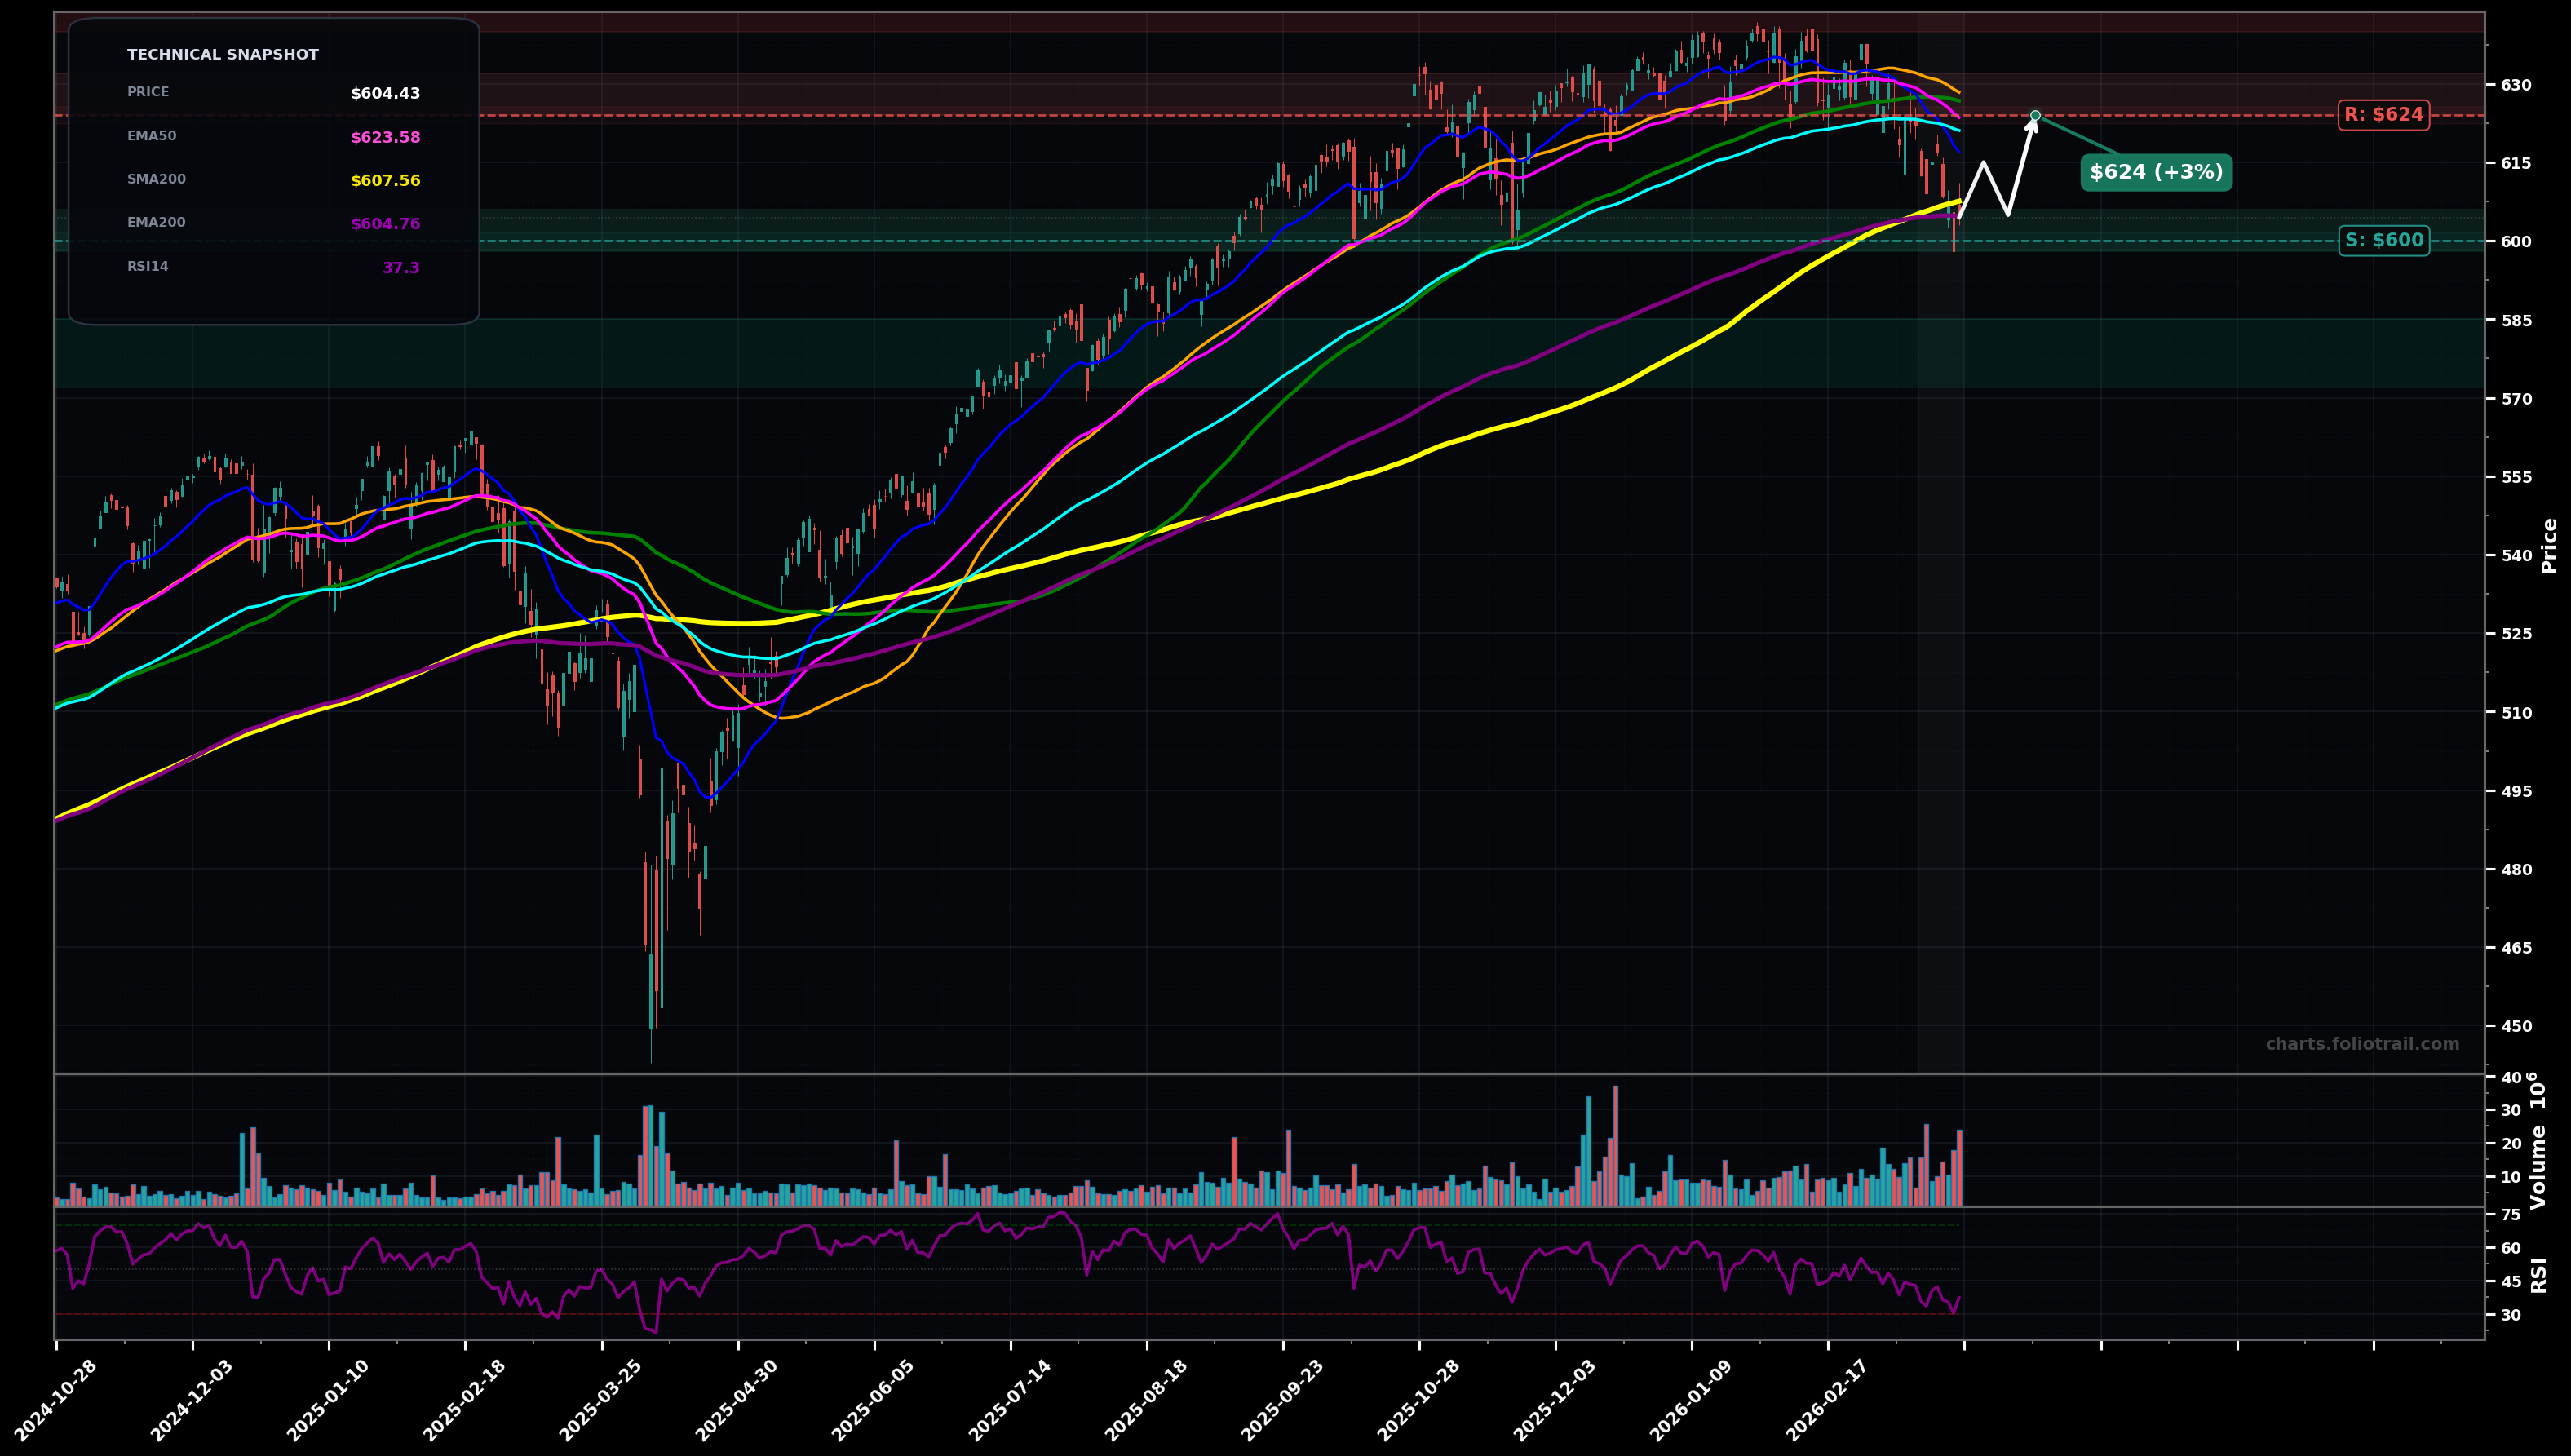
As of March 24, 2026, VOO (Vanguard S&P 500 ETF) is in a downtrend state on the daily chart, with a confidence level of 67%. Key support is at $600 and key resistance at $624. Pulled back hard from the $630 area; now trading below the fast MAs (SMA50/SMA100/EMA50/EMA100) and sitting near the $600-$605 zone with RSI ~$37.
Base/mean-reversion attempt: hold $600 area (near EMA200 ~$604.8) then bounce into the $615-$624 resistance band; if rejected, a retest of $600 is likely before any higher move.
Trend continuation: lose $600 and slide toward the rising longer-term supports (SMA200/EMA200 cluster then prior swing-demand). Expect oversold bounces but lower highs until $624 is reclaimed.
Daily close below $600 (and especially below $595) confirms continuation downside
Two consecutive daily closes back above $624 (reclaim EMA50/EMA100 zone) invalidate the immediate downtrend bias
Start near $600 (psych + EMA200), add on confirmed breakdown/retest into $590s, heavy add into deeper flush toward the next demand zone (~$575) where risk/reward improves if selling exhausts.
Trim into reclaim of the broken MA band/old highs ($624-$632) and more aggressively if price gets extended above prior ATH area; close if a multi-year stretch/risk-off top forms well above the prior range.
As of March 24, 2026, VOO (Vanguard S&P 500 ETF) is in a downtrend state on the daily chart with 67% confidence. Pulled back hard from the $630 area; now trading below the fast MAs (SMA50/SMA100/EMA50/EMA100) and sitting near the $600-$605 zone with RSI ~$37.
On the daily timeframe, VOO has key support at $600 and key resistance at $624. The most likely scenario (bullish) targets $615 and $624, with a revert level at $605.
VOO (Vanguard S&P 500 ETF) is currently classified as downtrend on the daily chart, with 67% confidence. Confirmation requires: Daily close below $600 (and especially below $595) confirms continuation downside This would be invalidated by: Two consecutive daily closes back above $624 (reclaim EMA50/EMA100 zone) invalidate the immediate downtrend bias
The most likely scenario (bullish) targets $615 and $624, with a revert level at $605. The alternative scenario (bearish) targets $595 and $575.
All content on this website — including charts, analysis, price targets, support/resistance levels, and position zones — is generated entirely by AI and provided for educational and informational purposes only.
This is not financial advice. NEXUSNOIR VENTURES SL (the operator of this website) is not a registered investment adviser or broker-dealer. You should not make investment decisions based solely on this information. Always do your own research and consult a qualified financial advisor.
By continuing, you acknowledge that you have read and agree to our full disclaimer & terms of use and privacy policy.