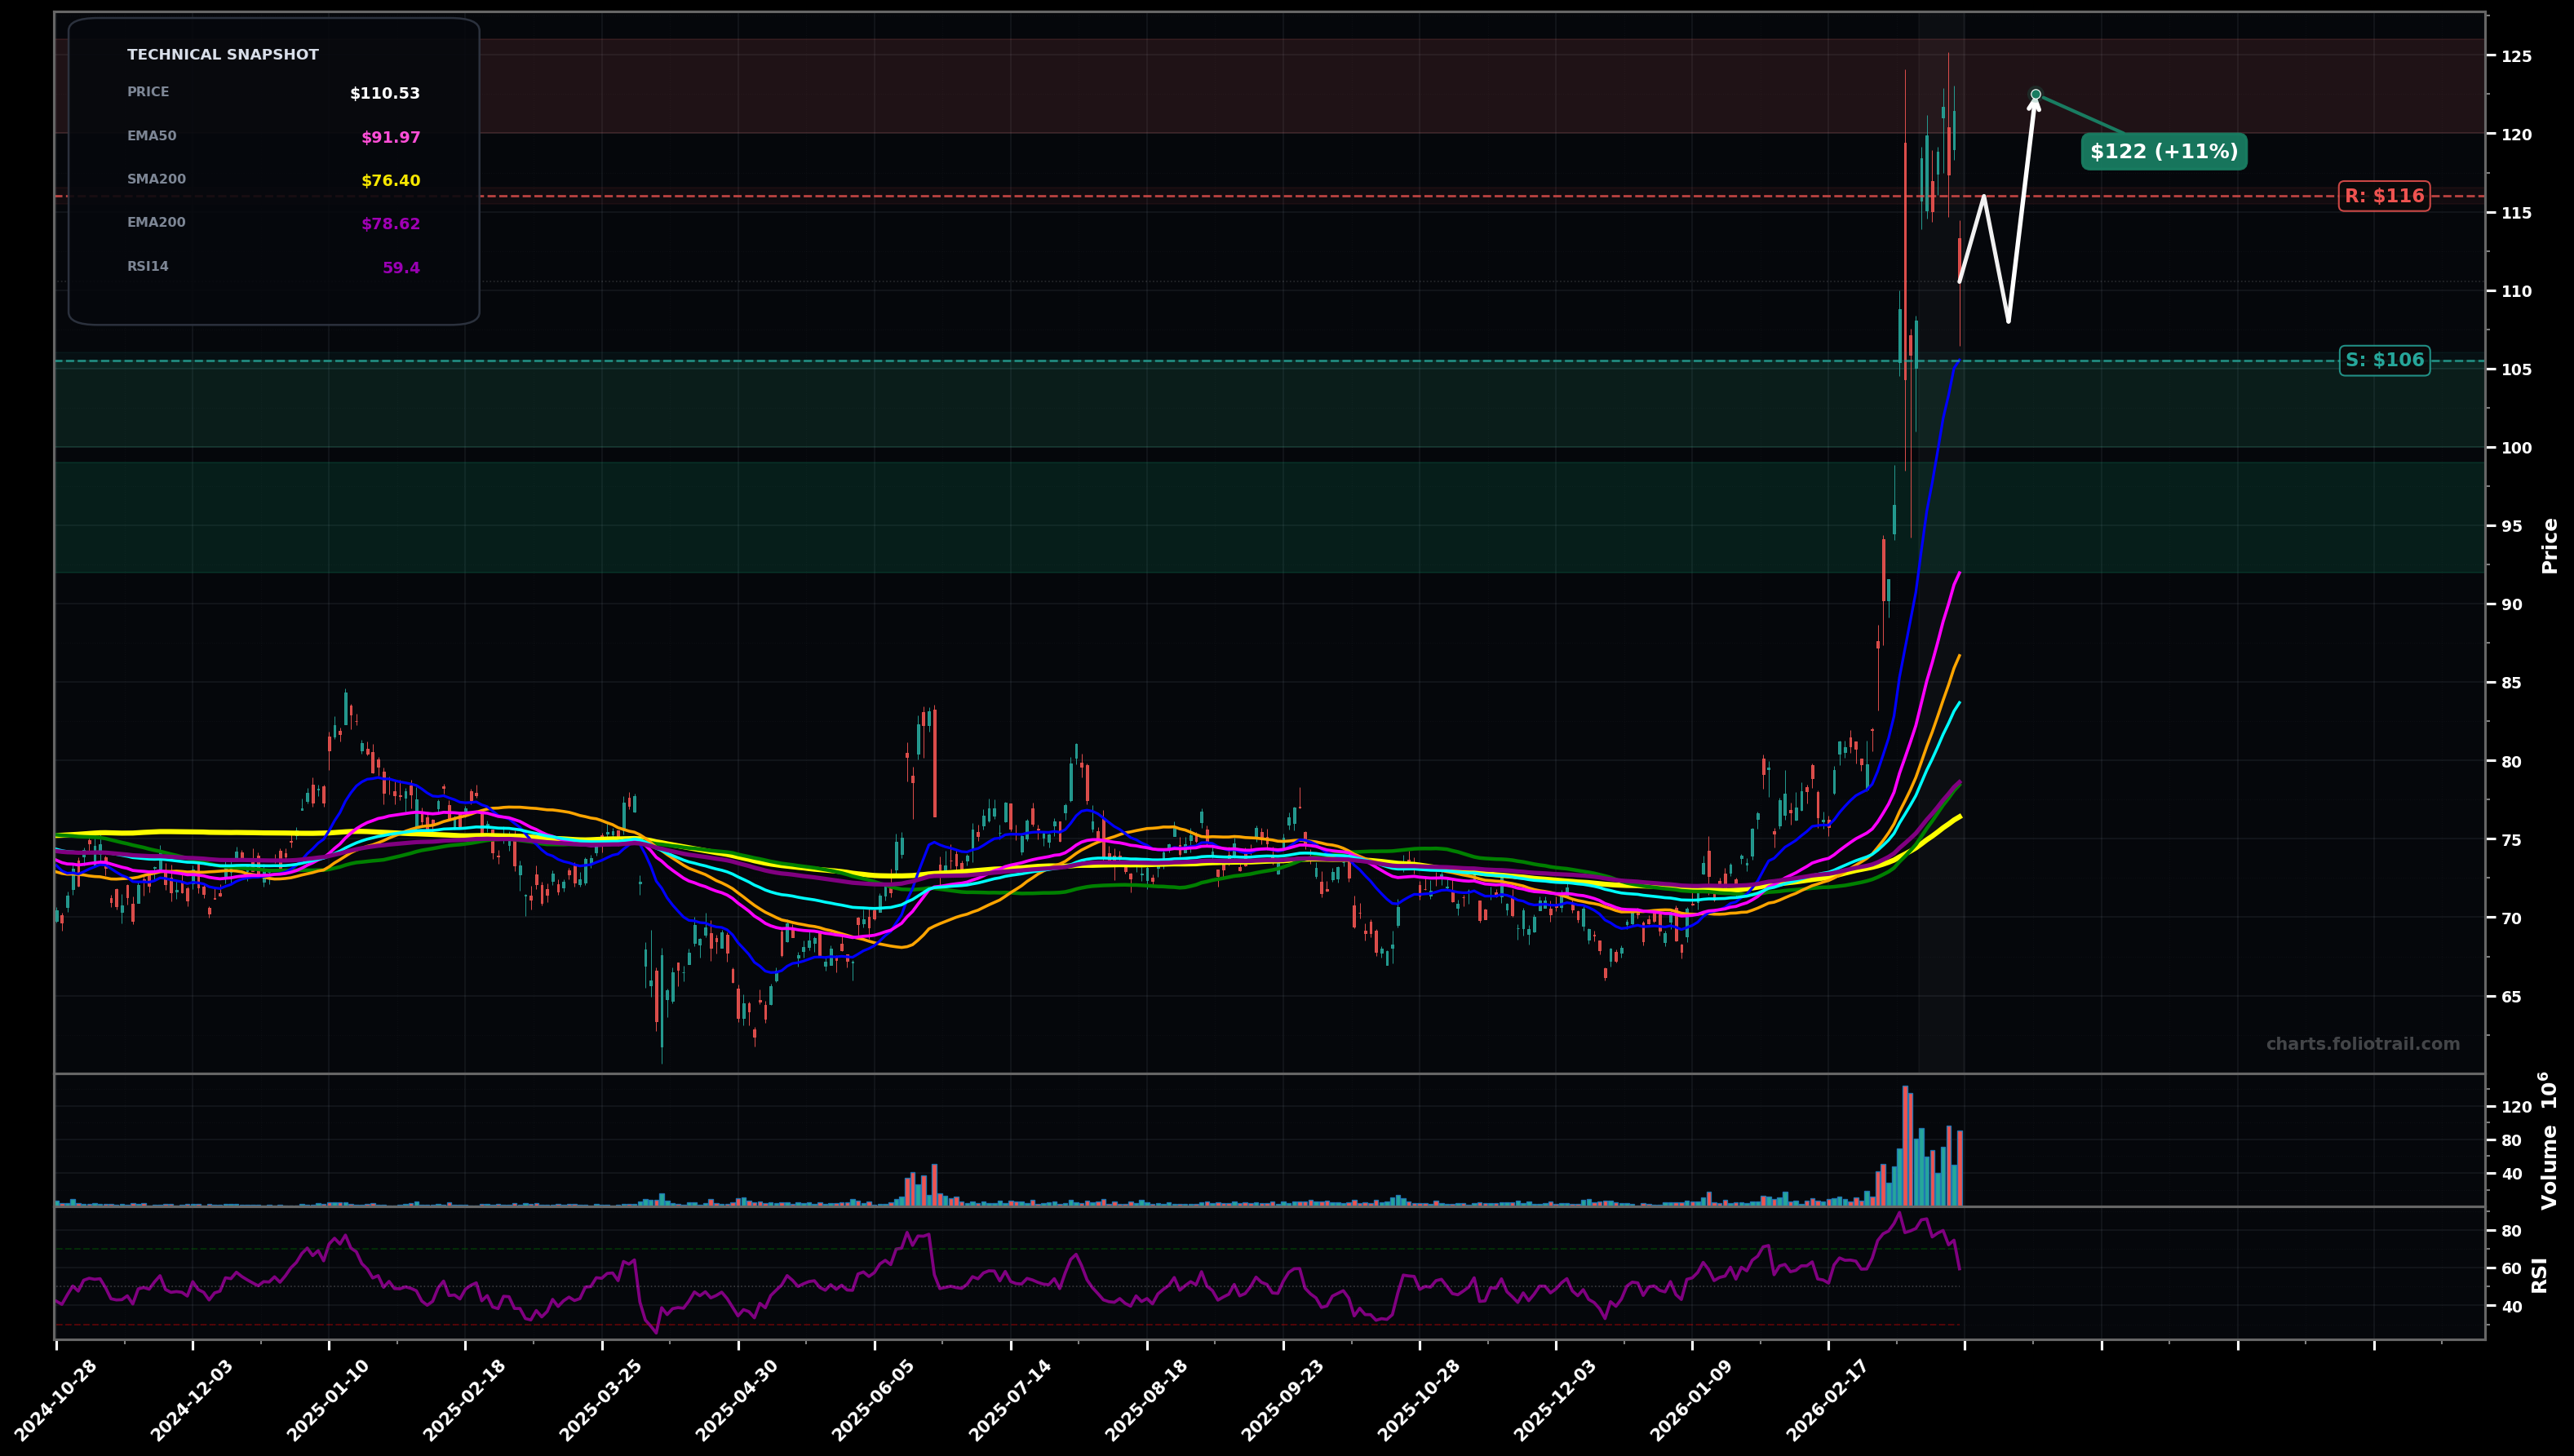
As of March 23, 2026, USO (United States Oil Fund) is in a volatility expansion state on the daily chart, with a confidence level of 74%. Key support is at $106 and key resistance at $116. Sharp impulsive breakout to ~$120 area followed by a fast pullback; price now ~$110.53 still well above rising short/mid MAs (EMA50/100/200 all below).
Bullish continuation: pullback holds above the $105.50–$106 zone (EMA20/near-term swing support), then resumes the impulse (Elliott: wave 3 extension already printed; current action is likely wave 4), targeting a retest of the prior high and a modest extension.
Deeper mean-reversion: failure to reclaim $116 and a breakdown below $105.50 triggers a larger wave-4 style correction toward the breakout base/clustered MAs (EMA50 + SMA50 area). (Fibs from ~$70 to ~$122: 38.2% ≈ mid-$90s; 50% ≈ mid-$90s/low-$90s zone), before attempting to stabilize.
2+ daily closes back above $116.00 would confirm upside continuation after the shakeout
A daily close below $105.50 (around EMA20) would invalidate the current post-breakout support structure and raise odds of a deeper mean reversion
Scale-in on a controlled pullback into prior breakout structure/EMA20 first; add at Fib-style mean reversion into the $90s (near EMA50/SMA50); heavy add only if it washes into the deeper base while still above major long-term MAs (EMA200/SMA200 ~high-$70s).
Trim into retests/expansions above the prior high where price becomes increasingly stretched vs EMA50/100; progressively de-risk on extensions typical of late-wave (wave 5) behavior in volatility-expansion regimes.
As of March 23, 2026, USO (United States Oil Fund) is in a volatility expansion state on the daily chart with 74% confidence. Sharp impulsive breakout to ~$120 area followed by a fast pullback; price now ~$110.53 still well above rising short/mid MAs (EMA50/100/200 all below).
On the daily timeframe, USO has key support at $106 and key resistance at $116. The most likely scenario (bullish) targets $116 and $122, with a revert level at $108.
USO (United States Oil Fund) is currently classified as volatility expansion on the daily chart, with 74% confidence. Confirmation requires: 2+ daily closes back above $116.00 would confirm upside continuation after the shakeout This would be invalidated by: A daily close below $105.50 (around EMA20) would invalidate the current post-breakout support structure and raise odds of a deeper mean reversion
The most likely scenario (bullish) targets $116 and $122, with a revert level at $108. The alternative scenario (bearish) targets $99.0 and $92.0.
All content on this website — including charts, analysis, price targets, support/resistance levels, and position zones — is generated entirely by AI and provided for educational and informational purposes only.
This is not financial advice. NEXUSNOIR VENTURES SL (the operator of this website) is not a registered investment adviser or broker-dealer. You should not make investment decisions based solely on this information. Always do your own research and consult a qualified financial advisor.
By continuing, you acknowledge that you have read and agree to our full disclaimer & terms of use and privacy policy.