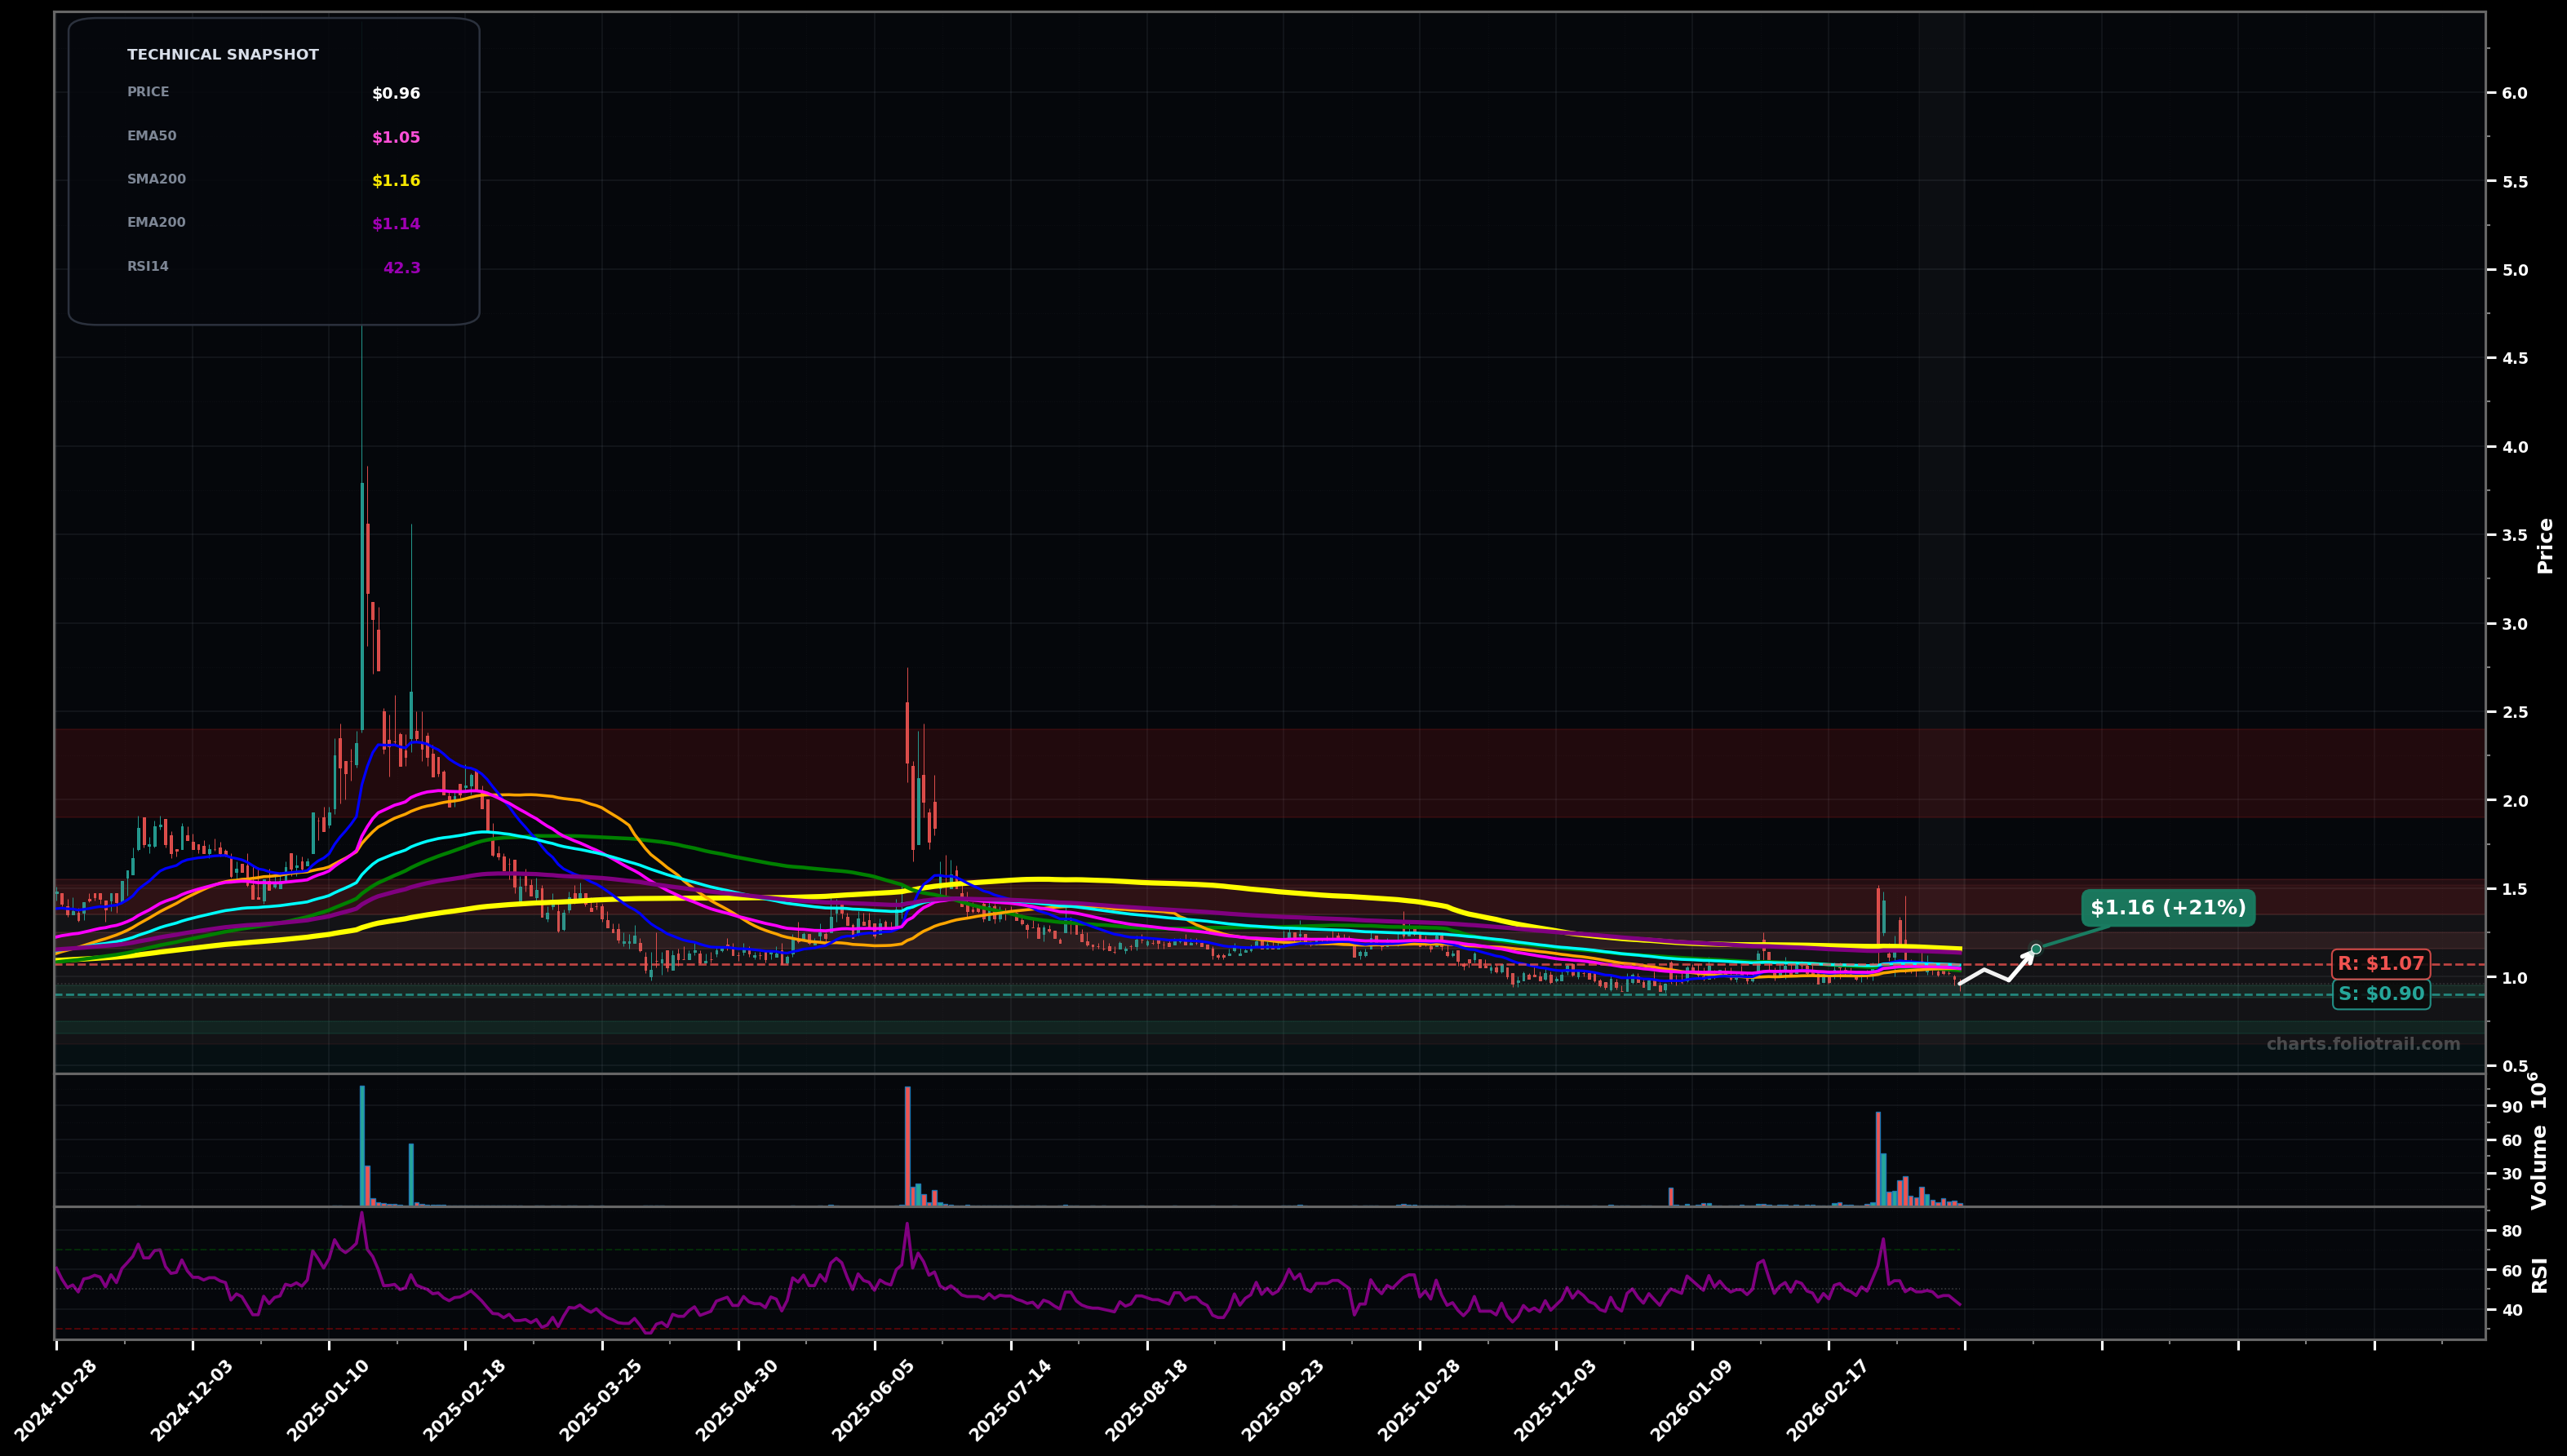
As of March 24, 2026, USEG (U.S. Energy Corp.) is in a downtrend state on the daily chart, with a confidence level of 67%. Key support is at $0.90 and key resistance at $1.07. Price at $0.96 is below all key MAs (SMA50/100/200 and EMA50/100/200); recent volume spike faded and price drifted back under ~$1.00 with RSI ~42 (weak momentum).
Base-building attempt: price holds $0.90–$0.95, grinds up into the MA cluster (EMA50/EMA100 and SMA50/100 around ~$1.03–$1.07) and likely stalls/rejects on first test.
Downtrend continuation: failure to hold $0.90 leads to a flush toward prior demand near the next psychological/support pocket, then a weak bounce that retests broken support as resistance.
Daily close below $0.90 (break of recent swing low support) would confirm ongoing downtrend continuation.
Two consecutive daily closes above $1.07 (EMA100 reclaim) would invalidate the downtrend bias and shift toward a reversal/base-breakout view.
DCA around swing-low support ($0.90 area), add on a breakdown-to-demand pocket ($0.80s), heavy add only if capitulation pushes into deeper support while risk is defined against further LLs.
Trim into overhead MA200/SMA200 supply (~$1.14–$1.16) and prior breakdown zones; close more aggressively if a larger mean-reversion rally retraces into prior impulse/failed-spike resistance.
As of March 24, 2026, USEG (U.S. Energy Corp.) is in a downtrend state on the daily chart with 67% confidence. Price at $0.96 is below all key MAs (SMA50/100/200 and EMA50/100/200); recent volume spike faded and price drifted back under ~$1.00 with RSI ~42 (weak momentum).
On the daily timeframe, USEG has key support at $0.90 and key resistance at $1.07. The most likely scenario (bullish) targets $1.04 and $1.16, with a revert level at $0.98.
USEG (U.S. Energy Corp.) is currently classified as downtrend on the daily chart, with 67% confidence. Confirmation requires: Daily close below $0.90 (break of recent swing low support) would confirm ongoing downtrend continuation. This would be invalidated by: Two consecutive daily closes above $1.07 (EMA100 reclaim) would invalidate the downtrend bias and shift toward a reversal/base-breakout view.
The most likely scenario (bullish) targets $1.04 and $1.16, with a revert level at $0.98. The alternative scenario (bearish) targets $0.80 and $0.70.
All content on this website — including charts, analysis, price targets, support/resistance levels, and position zones — is generated entirely by AI and provided for educational and informational purposes only.
This is not financial advice. NEXUSNOIR VENTURES SL (the operator of this website) is not a registered investment adviser or broker-dealer. You should not make investment decisions based solely on this information. Always do your own research and consult a qualified financial advisor.
By continuing, you acknowledge that you have read and agree to our full disclaimer & terms of use and privacy policy.