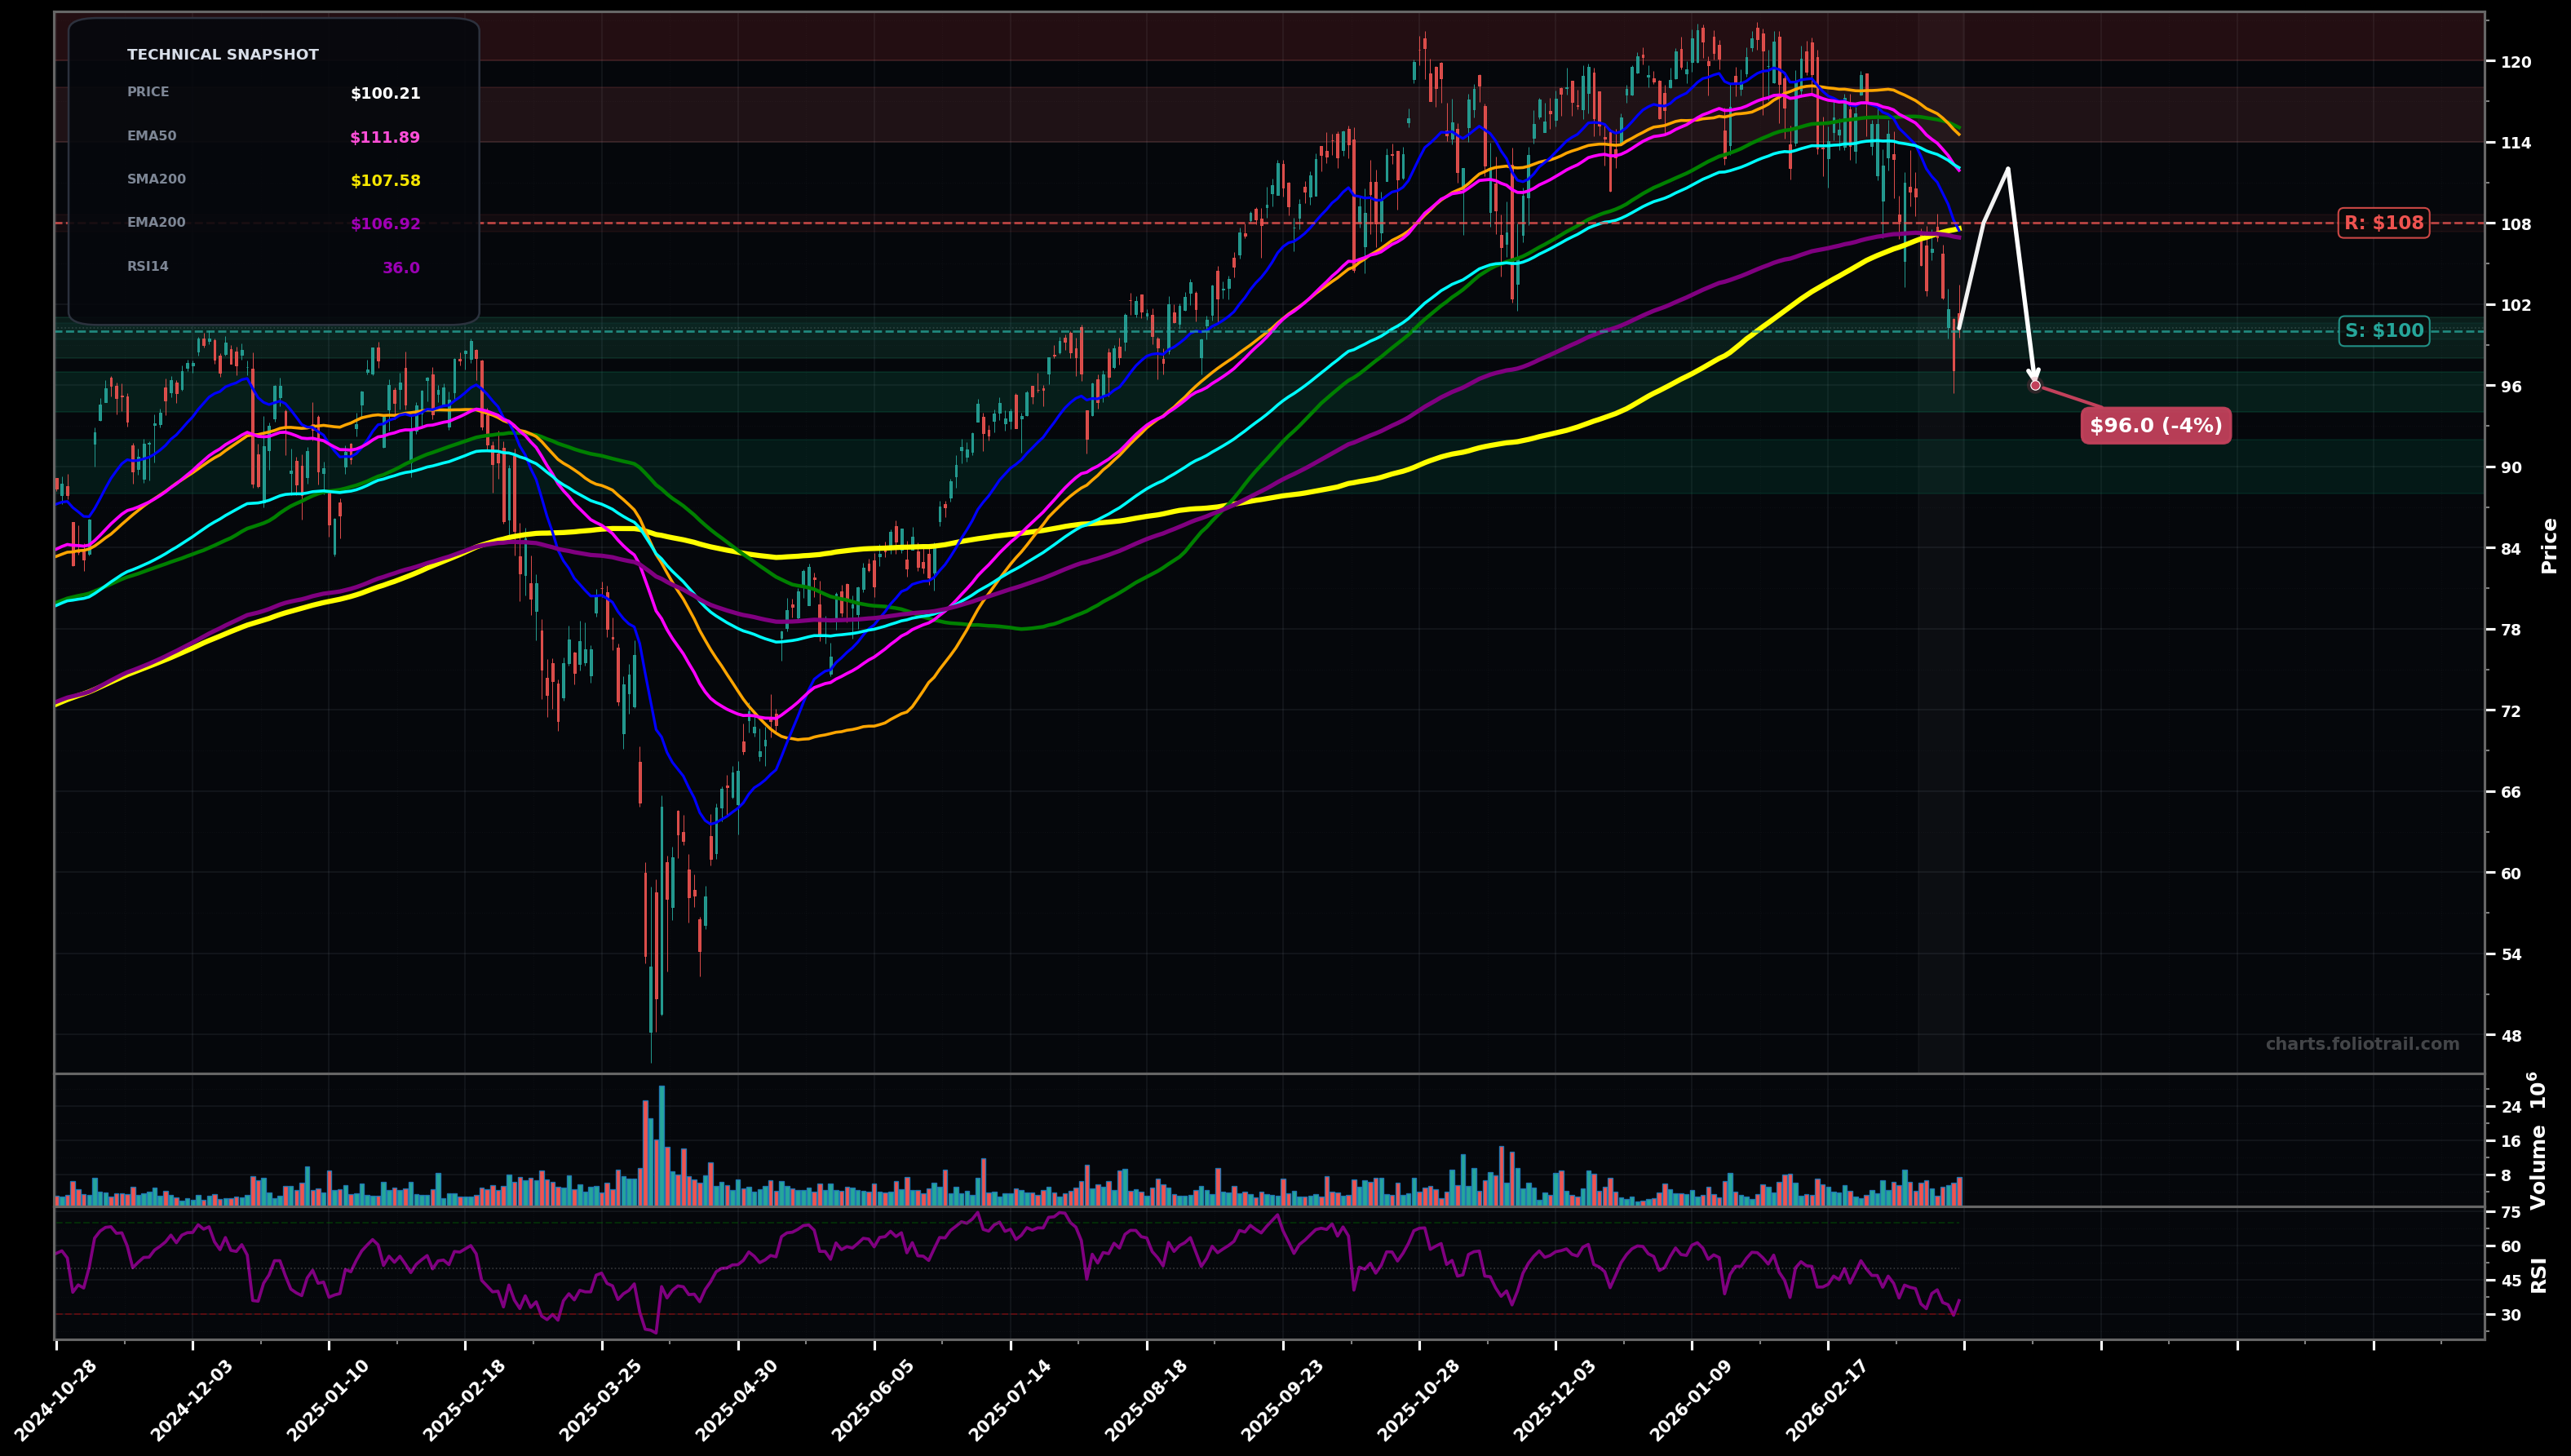
As of March 24, 2026, UPRO (ProShares UltraPro S&P500) is in a downtrend state on the daily chart, with a confidence level of 72%. Key support is at $100 and key resistance at $108. Sharp selloff from the $120s with a breakdown below the clustered fast MAs (SMA50/SMA100/EMA50/EMA100) and a fast drop toward the rising long-term averages; RSI(14) ~36 (weak momentum).
Base/oversold bounce (likely Wave 4 or corrective A-B-C) back toward the breakdown zone, then rejection near the EMA200/purple + prior support around $108–$112, followed by another leg down to test the rising SMA200 (yellow) and/or the prior swing low area.
Undercut-and-rally: price holds $100, quickly reclaims the EMA200 (purple) and then pushes into the MA cluster (EMA50/EMA100/SMA50/SMA100) for a trend repair attempt; this would look like the start of a larger corrective recovery (potential Wave 2/4 completion leading into a new advance).
Daily close below $99.00 (clean break under the recent $100 round-number support) would confirm continuation lower.
Two consecutive daily closes back above $108.00 (reclaim of EMA200/purple area and breakdown zone) would invalidate the current downtrend impulse.
Start near $100 pivot support; add into a likely SMA200 (yellow) test/0.382–0.5 type retrace of the prior up-leg; heavy add only if a deeper flush approaches the next major demand zone (prior consolidation) while monitoring for a swing low/high reference reversal.
Trim into prior supply and the overhead MA cluster where failed rallies often stall; heavier trims near the prior highs; full close only on a clear extension well above the prior peak (stretched vs long-term MAs).
As of March 24, 2026, UPRO (ProShares UltraPro S&P500) is in a downtrend state on the daily chart with 72% confidence. Sharp selloff from the $120s with a breakdown below the clustered fast MAs (SMA50/SMA100/EMA50/EMA100) and a fast drop toward the rising long-term averages; RSI(14) ~36 (weak momentum).
On the daily timeframe, UPRO has key support at $100 and key resistance at $108. The most likely scenario (bearish) targets $108 and $96.0, with a revert level at $112.
UPRO (ProShares UltraPro S&P500) is currently classified as downtrend on the daily chart, with 72% confidence. Confirmation requires: Daily close below $99.00 (clean break under the recent $100 round-number support) would confirm continuation lower. This would be invalidated by: Two consecutive daily closes back above $108.00 (reclaim of EMA200/purple area and breakdown zone) would invalidate the current downtrend impulse.
The most likely scenario (bearish) targets $108 and $96.0, with a revert level at $112. The alternative scenario (bullish) targets $112 and $116.
All content on this website — including charts, analysis, price targets, support/resistance levels, and position zones — is generated entirely by AI and provided for educational and informational purposes only.
This is not financial advice. NEXUSNOIR VENTURES SL (the operator of this website) is not a registered investment adviser or broker-dealer. You should not make investment decisions based solely on this information. Always do your own research and consult a qualified financial advisor.
By continuing, you acknowledge that you have read and agree to our full disclaimer & terms of use and privacy policy.