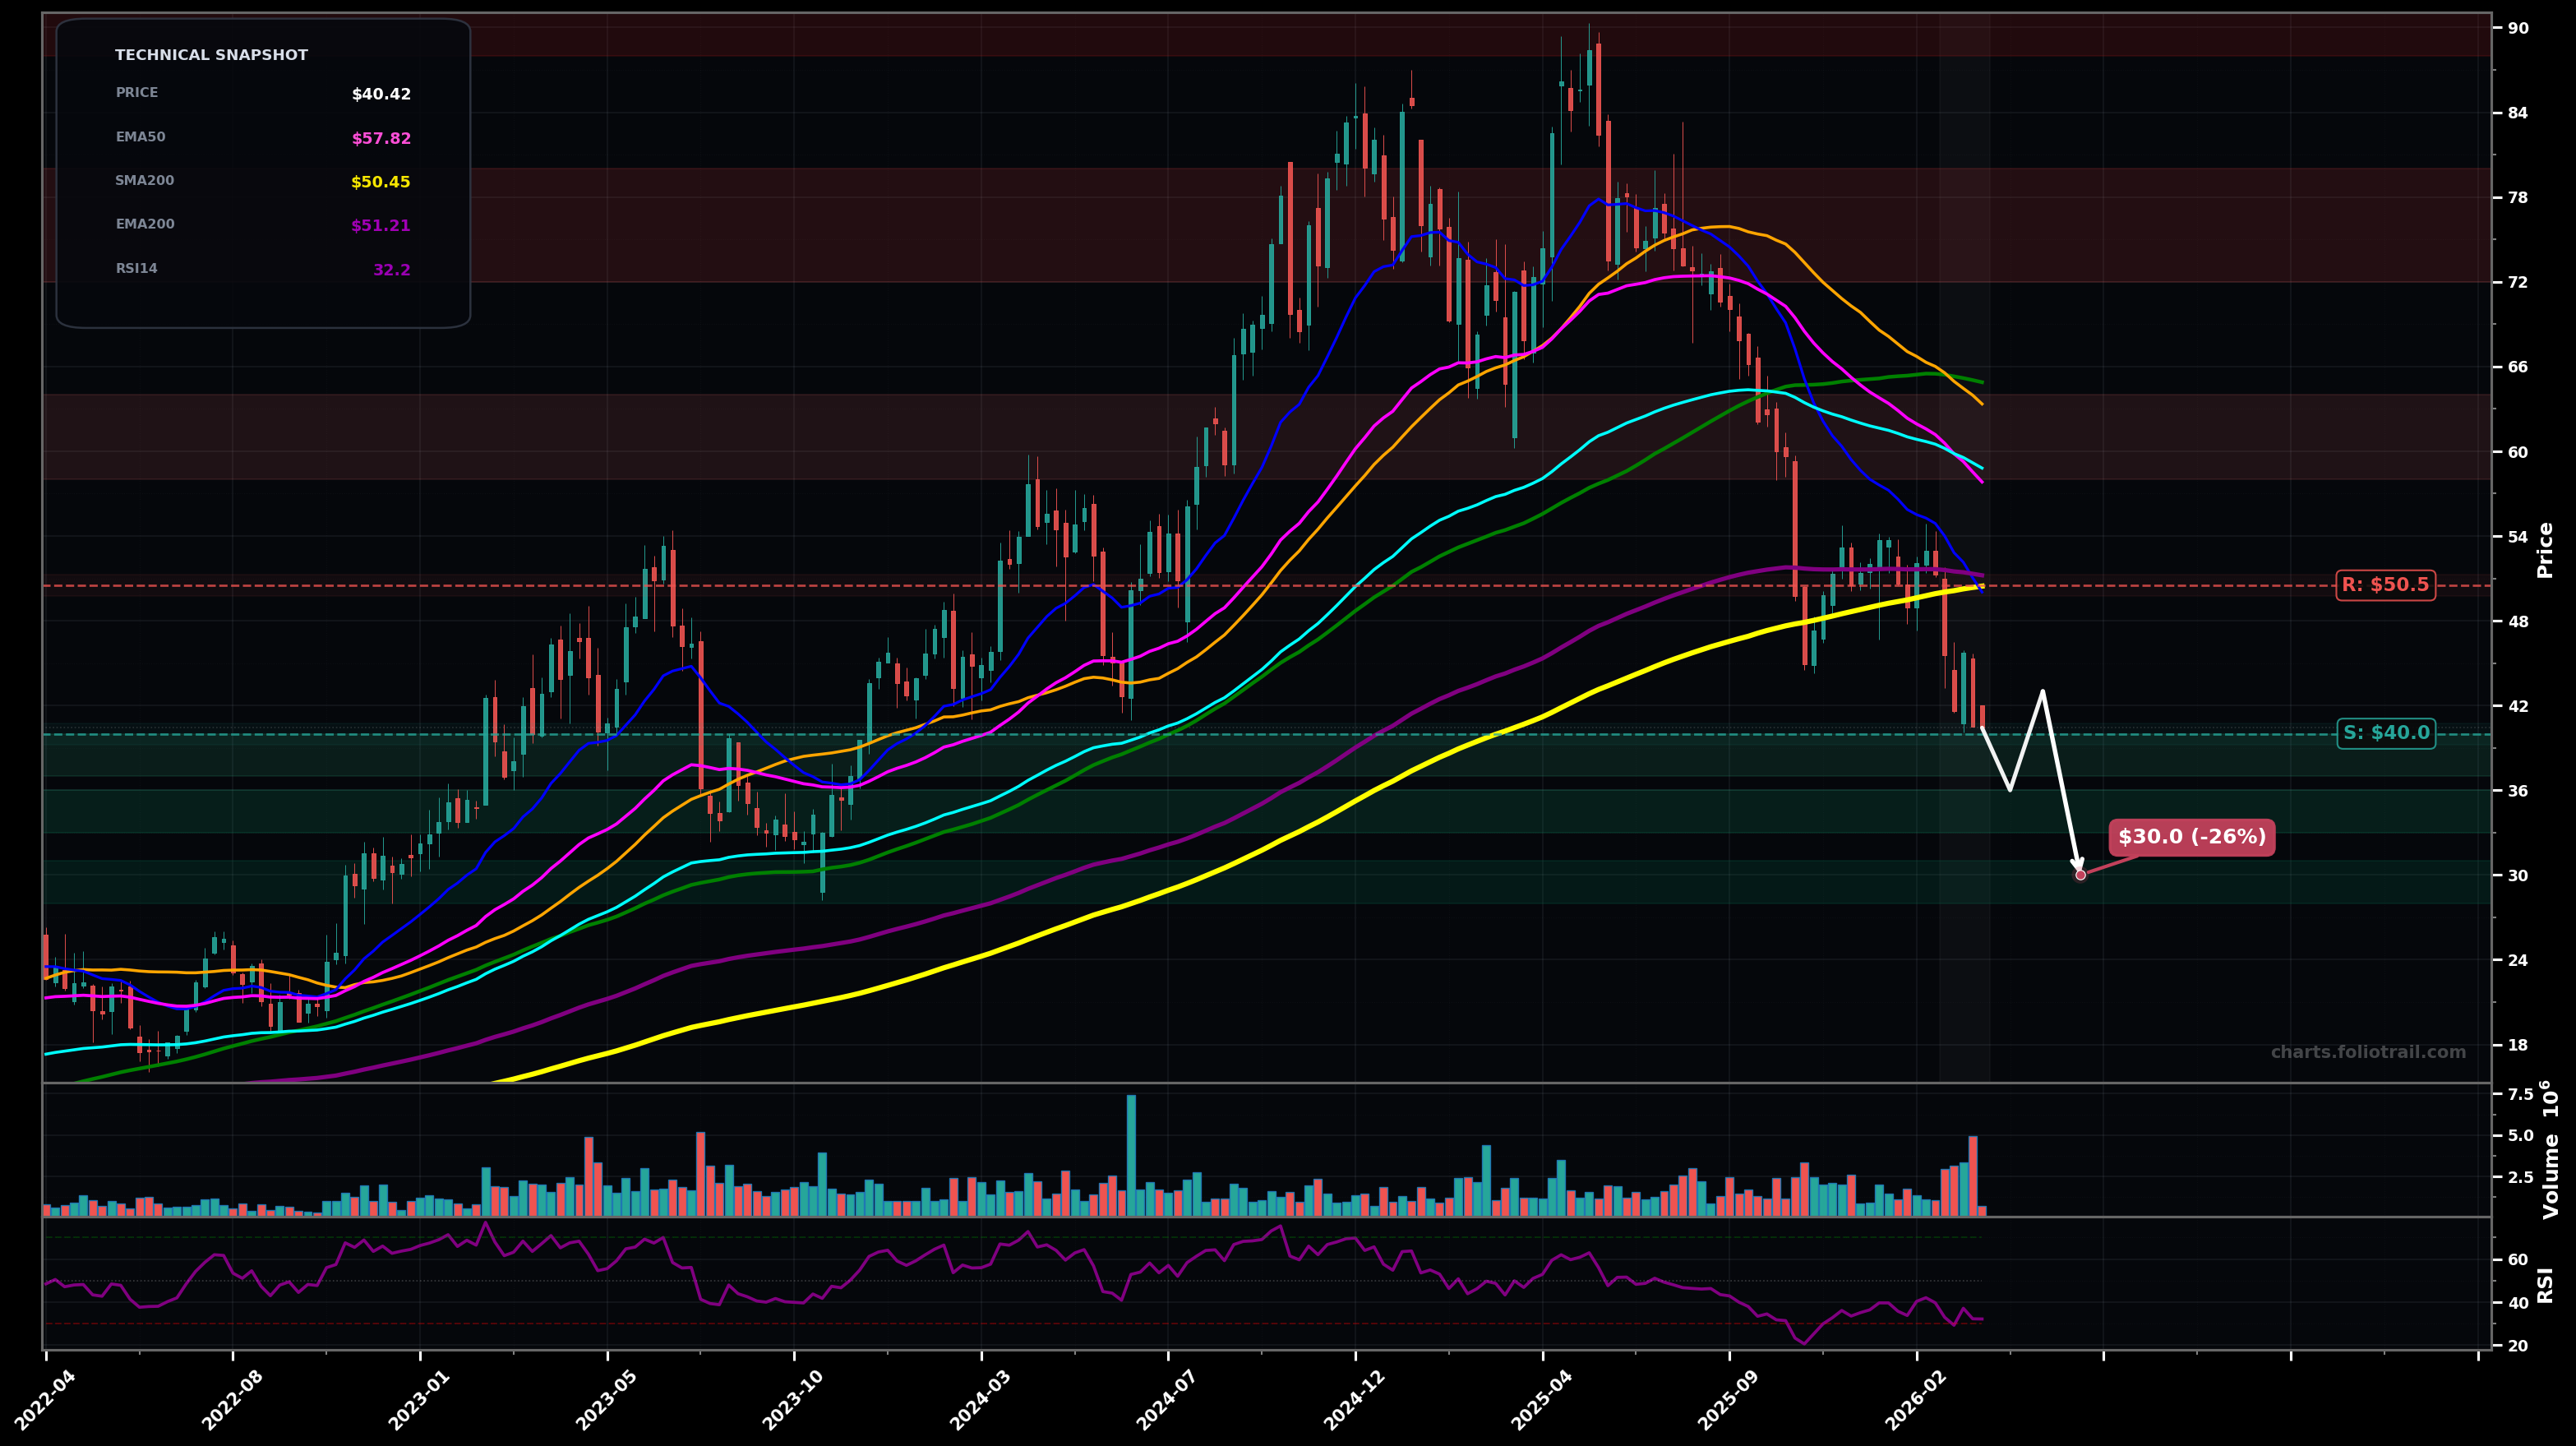
As of March 24, 2026, TGLS (Tecnoglass Inc.) is in a falling knife state on the weekly chart, with a confidence level of 74%. Key support is at $40.0 and key resistance at $50.5. Weekly breakdown: price at $40.42 sold through the rising SMA200 (~$50.45) and is now extended below all key MAs; RSI14 ~32 shows bearish momentum with early oversold pressure.
Bear continuation (likely Wave C / Wave 3-type extension): sellers press under $40, then a reflex bounce retests ~$42–$44 before continuation lower; watch for capitulation volume and a swing low/high reference forming.
Mean-reversion rebound (counter-trend Wave 4 / B-wave): price defends ~$40 and squeezes back toward the broken MA shelf; likely stalls into the EMA200/SMA200 area and then decides (either base or rollover).
Weekly close below $40.00 followed by a push to $37–$36 within the next 1–3 weeks.
Two consecutive weekly closes back above $50.50 (reclaim of SMA200/EMA200 zone).
Start near current breakdown support ($40) only if selling weakens; add into likely Fib extensions/next demand shelves (~$36 then ~$30) where a weekly swing low (60-bar pivot) is more probable.
Trim into prior distribution/MA clusters: first around EMA50/EMA100 reclaim zone (~$58–$64), heavier into prior swing supply (~$72–$80), and close near the prior cycle high area (~$90) where upside becomes historically stretched.
As of March 24, 2026, TGLS (Tecnoglass Inc.) is in a falling knife state on the weekly chart with 74% confidence. Weekly breakdown: price at $40.42 sold through the rising SMA200 (~$50.45) and is now extended below all key MAs; RSI14 ~32 shows bearish momentum with early oversold pressure.
On the weekly timeframe, TGLS has key support at $40.0 and key resistance at $50.5. The most likely scenario (bearish) targets $36.0 and $30.0, with a revert level at $43.0.
TGLS (Tecnoglass Inc.) is currently classified as falling knife on the weekly chart, with 74% confidence. Confirmation requires: Weekly close below $40.00 followed by a push to $37–$36 within the next 1–3 weeks. This would be invalidated by: Two consecutive weekly closes back above $50.50 (reclaim of SMA200/EMA200 zone).
The most likely scenario (bearish) targets $36.0 and $30.0, with a revert level at $43.0. The alternative scenario (bullish) targets $45.0 and $50.5.
All content on this website — including charts, analysis, price targets, support/resistance levels, and position zones — is generated entirely by AI and provided for educational and informational purposes only.
This is not financial advice. NEXUSNOIR VENTURES SL (the operator of this website) is not a registered investment adviser or broker-dealer. You should not make investment decisions based solely on this information. Always do your own research and consult a qualified financial advisor.
By continuing, you acknowledge that you have read and agree to our full disclaimer & terms of use and privacy policy.