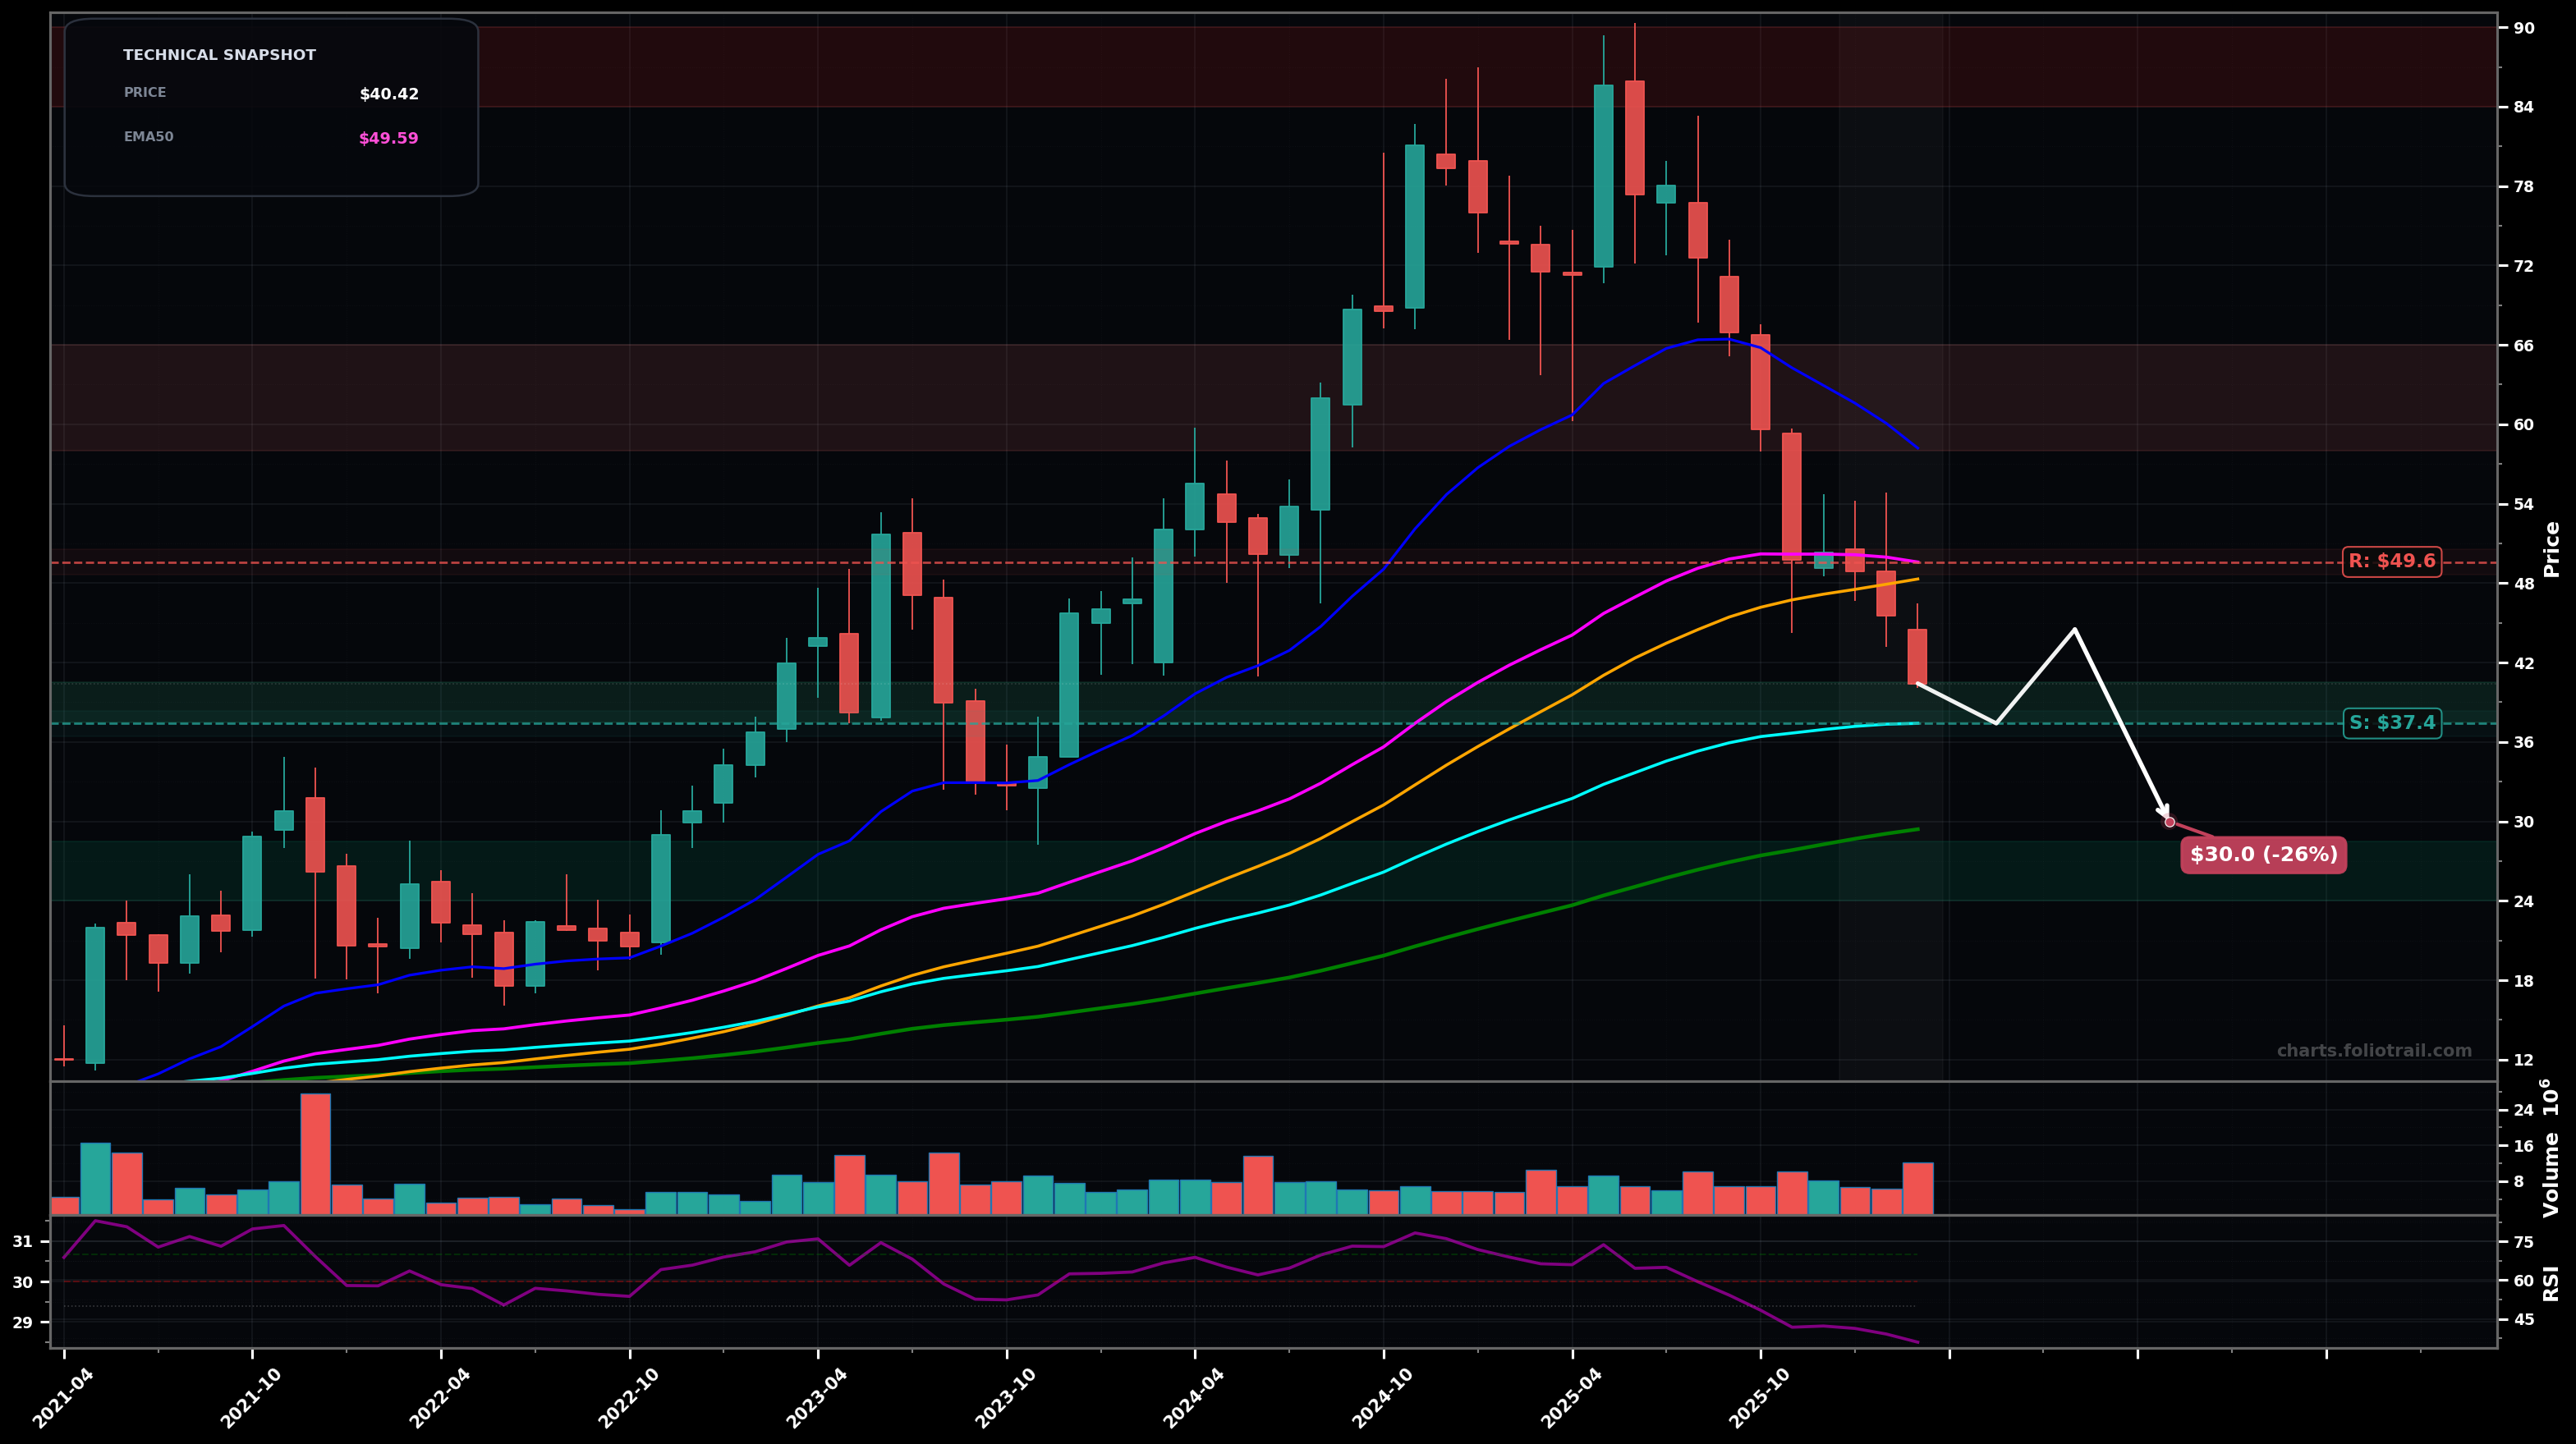
As of March 24, 2026, TGLS (Tecnoglass Inc.) is in a downtrend state on the monthly chart, with a confidence level of 72%. Key support is at $37.4 and key resistance at $49.6. Monthly selloff from the ~$80s with consecutive red candles; price (~$40.42) broke back below the EMA50 (~$49.59) and is sliding toward the rising EMA100 (~$37.40); RSI14 ~35.9 (weak momentum).
Downtrend continues as a Wave C / Wave 4-to-5 transition: price tests the EMA100 (~$37.4) first; if it fails to hold, a flush toward the prior swing support zone (Fib 0.618-0.786 of the $85->$40 leg) becomes likely before any durable base forms.
Mean-reversion bounce / bottoming attempt: price holds above the EMA100 (~$37.4) and forms a higher low on the monthly, then reclaims EMA50; this would look like an ABC corrective rally back into the prior breakdown area before the next decision point.
Monthly close below $37.40 (EMA100) would confirm downside continuation.
Two consecutive monthly closes back above $49.60 (EMA50) would invalidate the current downtrend call.
Starter near EMA100/support confluence; add on breakdown into prior base/EMA200-area demand; heavy add only if capitulation drives into deeper Fib retrace and long-term MA support.
Trim into reclaim of major breakdown zones and prior supply (Fib retraces of the selloff); close into retest/overthrow of the prior cycle highs where risk/reward typically deteriorates.
As of March 24, 2026, TGLS (Tecnoglass Inc.) is in a downtrend state on the monthly chart with 72% confidence. Monthly selloff from the ~$80s with consecutive red candles; price (~$40.42) broke back below the EMA50 (~$49.59) and is sliding toward the rising EMA100 (~$37.40); RSI14 ~35.9 (weak momentum).
On the monthly timeframe, TGLS has key support at $37.4 and key resistance at $49.6. The most likely scenario (bearish) targets $37.4 and $30.0, with a revert level at $44.5.
TGLS (Tecnoglass Inc.) is currently classified as downtrend on the monthly chart, with 72% confidence. Confirmation requires: Monthly close below $37.40 (EMA100) would confirm downside continuation. This would be invalidated by: Two consecutive monthly closes back above $49.60 (EMA50) would invalidate the current downtrend call.
The most likely scenario (bearish) targets $37.4 and $30.0, with a revert level at $44.5. The alternative scenario (bullish) targets $49.6 and $58.2.
All content on this website — including charts, analysis, price targets, support/resistance levels, and position zones — is generated entirely by AI and provided for educational and informational purposes only.
This is not financial advice. NEXUSNOIR VENTURES SL (the operator of this website) is not a registered investment adviser or broker-dealer. You should not make investment decisions based solely on this information. Always do your own research and consult a qualified financial advisor.
By continuing, you acknowledge that you have read and agree to our full disclaimer & terms of use and privacy policy.