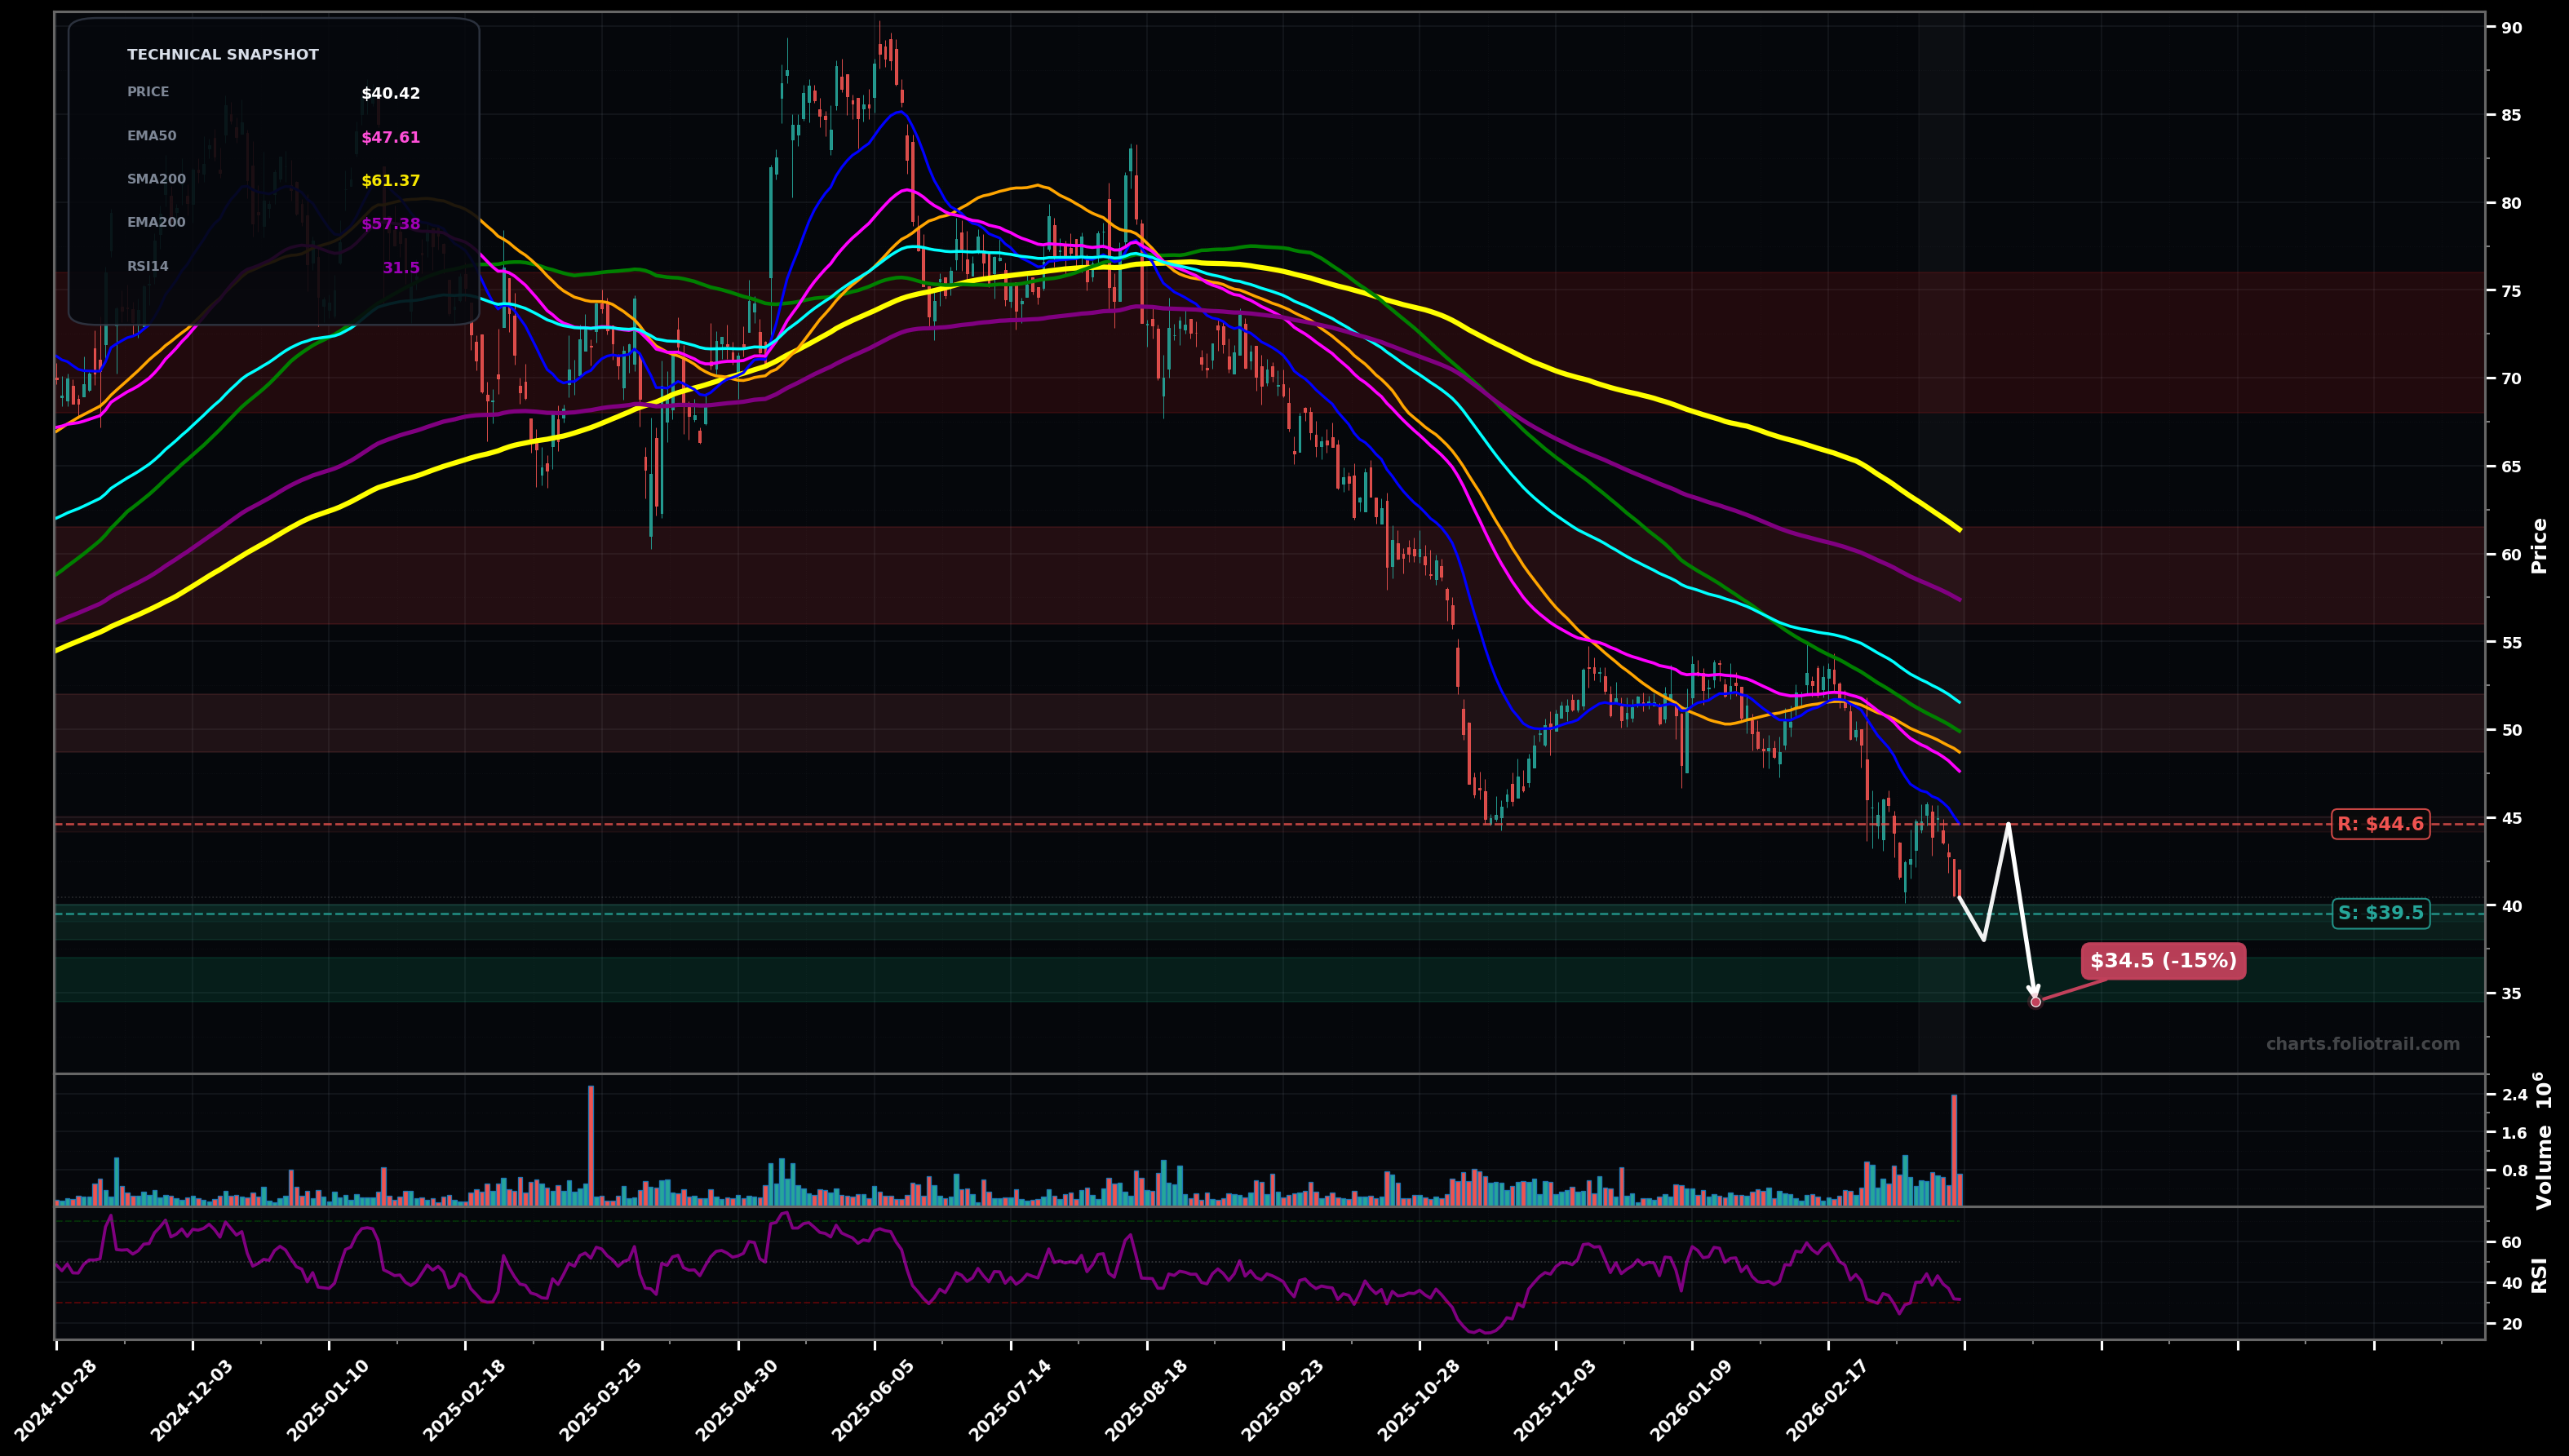
As of March 24, 2026, TGLS (Tecnoglass Inc.) is in a falling knife state on the daily chart, with a confidence level of 78%. Key support is at $39.5 and key resistance at $44.6. Price at ~$40.42 making fresh LLs after a weak bounce; trading well below all key MAs with heavy selloff candles and RSI ~31 (near oversold).
Continuation lower: another support break, then a brief oversold bounce that fails under the falling EMA20/EMA50 and rolls into another leg down (Elliott: likely still in wave 3 or extending wave 5 of the decline).
Capitulation then base: spike down into support, quick rebound (undercut-and-rally) and range-building; attempts to reclaim EMA50 (pink) and then EMA100 (cyan).
Daily close below $39.50 (clean break/hold under the current low zone) would confirm continued falling-knife conditions.
Two consecutive daily closes back above $44.60 (reclaim/hold above EMA20 area) would invalidate the falling-knife call and shift to a bottoming attempt.
Start near current swing-low support, add on a deeper flush toward the next demand pocket; heavy add only on capitulation into a larger Fibonacci/round-number zone while RSI is depressed and volatility spikes.
Trim into first meaningful MA cluster reclaim (EMA50/EMA100 zone), trim more into SMA100/SMA200 overhead supply, close into major long-term mean reversion toward SMA200 where prior distribution occurred.
As of March 24, 2026, TGLS (Tecnoglass Inc.) is in a falling knife state on the daily chart with 78% confidence. Price at ~$40.42 making fresh LLs after a weak bounce; trading well below all key MAs with heavy selloff candles and RSI ~31 (near oversold).
On the daily timeframe, TGLS has key support at $39.5 and key resistance at $44.6. The most likely scenario (bearish) targets $38.0 and $34.5, with a revert level at $44.6.
TGLS (Tecnoglass Inc.) is currently classified as falling knife on the daily chart, with 78% confidence. Confirmation requires: Daily close below $39.50 (clean break/hold under the current low zone) would confirm continued falling-knife conditions. This would be invalidated by: Two consecutive daily closes back above $44.60 (reclaim/hold above EMA20 area) would invalidate the falling-knife call and shift to a bottoming attempt.
The most likely scenario (bearish) targets $38.0 and $34.5, with a revert level at $44.6. The alternative scenario (bullish) targets $48.7 and $51.5.
All content on this website — including charts, analysis, price targets, support/resistance levels, and position zones — is generated entirely by AI and provided for educational and informational purposes only.
This is not financial advice. NEXUSNOIR VENTURES SL (the operator of this website) is not a registered investment adviser or broker-dealer. You should not make investment decisions based solely on this information. Always do your own research and consult a qualified financial advisor.
By continuing, you acknowledge that you have read and agree to our full disclaimer & terms of use and privacy policy.