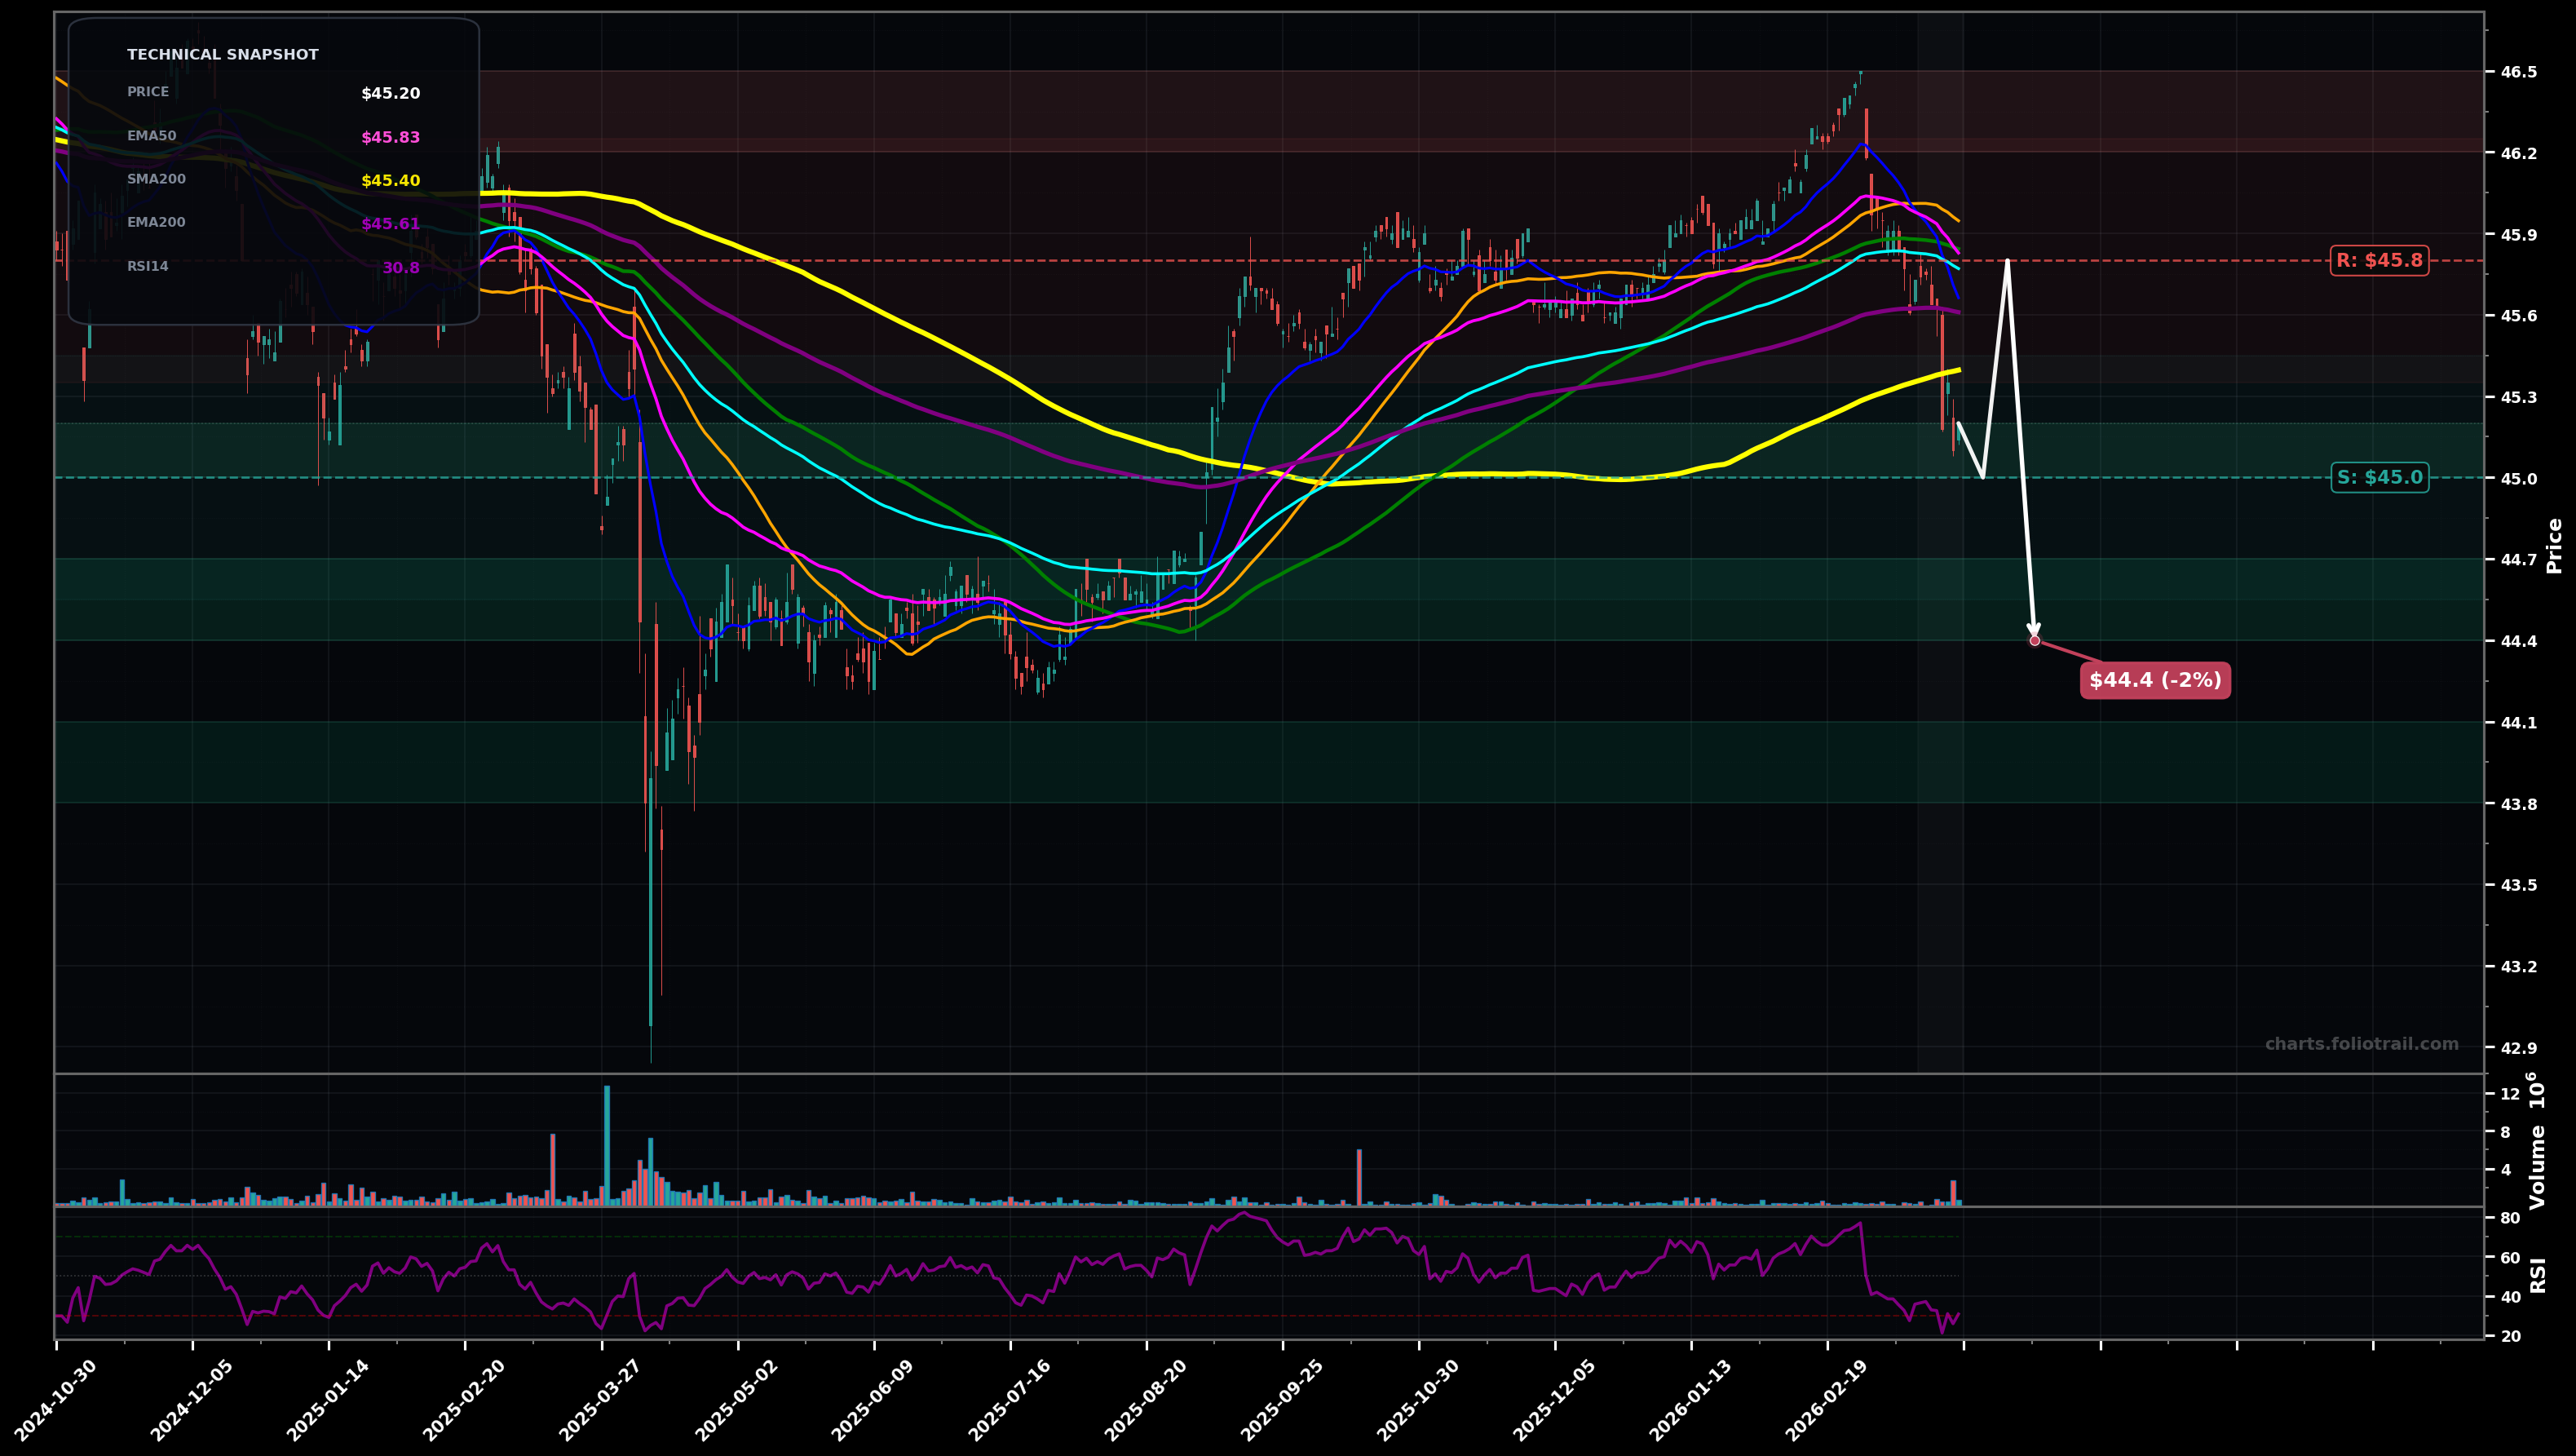
As of March 26, 2026, TFI (SPDR Nuveen Bloomberg Municipal Bond ETF) is in a downtrend state on the daily chart, with a confidence level of 63%. Key support is at $45.0 and key resistance at $45.8. Sharp selloff from recent swing high (~$46.5) with price now ~$45.20; bearish MA compression/rollover and RSI deeply oversold (~31).
Base/relief bounce from the $45.0 area (oversold RSI) followed by a retest of the broken MA cluster; rejection there keeps the market in a corrective pullback (likely Wave 4/early Wave 5 down within the prior up-leg correction).
Breakdown fails: price holds $45.0, reclaims $45.8–$46.0 (EMA50/EMA100 area) and rotates back toward the prior swing high; this would fit a Wave 4 ending and Wave 5 attempt higher.
Daily close below $45.00 (with follow-through) confirms downside continuation toward the next support band.
Two daily closes back above $45.80 would invalidate the immediate downtrend and suggest a breakdown-failure/reclaim.
Start near current swing-low support (~$45); add at the next demand shelf/mean-reversion zone (~$44.4–$44.7); heavy add only if a deeper fib-style retrace/undercut into prior base (~$43.8–$44.1) holds.
Trim into prior swing-high resistance (~$46.2–$46.5); larger trims if price gets extended above the prior peak into a likely wave extension zone (~$46.8–$47.2); consider full exit if a strong overshoot/extension (>~$47.5) occurs versus the MA stack.
As of March 26, 2026, TFI (SPDR Nuveen Bloomberg Municipal Bond ETF) is in a downtrend state on the daily chart with 63% confidence. Sharp selloff from recent swing high (~$46.5) with price now ~$45.20; bearish MA compression/rollover and RSI deeply oversold (~31).
On the daily timeframe, TFI has key support at $45.0 and key resistance at $45.8. The most likely scenario (bearish) targets $45.0 and $44.4, with a revert level at $45.8.
TFI (SPDR Nuveen Bloomberg Municipal Bond ETF) is currently classified as downtrend on the daily chart, with 63% confidence. Confirmation requires: Daily close below $45.00 (with follow-through) confirms downside continuation toward the next support band. This would be invalidated by: Two daily closes back above $45.80 would invalidate the immediate downtrend and suggest a breakdown-failure/reclaim.
The most likely scenario (bearish) targets $45.0 and $44.4, with a revert level at $45.8. The alternative scenario (bullish) targets $46.2 and $46.5.
Multi-layer AI agents analyse 200+ stocks across daily, weekly, and monthly timeframes — producing market state classifications, price scenarios with targets, and position entry/exit levels. Updated every trading day after market close. No paywall. No sign-up required.
Built by Foliotrail.
All content on this website — including charts, analysis, price targets, support/resistance levels, and position zones — is generated entirely by AI and provided for educational and informational purposes only.
This is not financial advice. NEXUSNOIR VENTURES SL (the operator of this website) is not a registered investment adviser or broker-dealer. You should not make investment decisions based solely on this information. Always do your own research and consult a qualified financial advisor.
By continuing, you acknowledge that you have read and agree to our full disclaimer & terms of use and privacy policy.