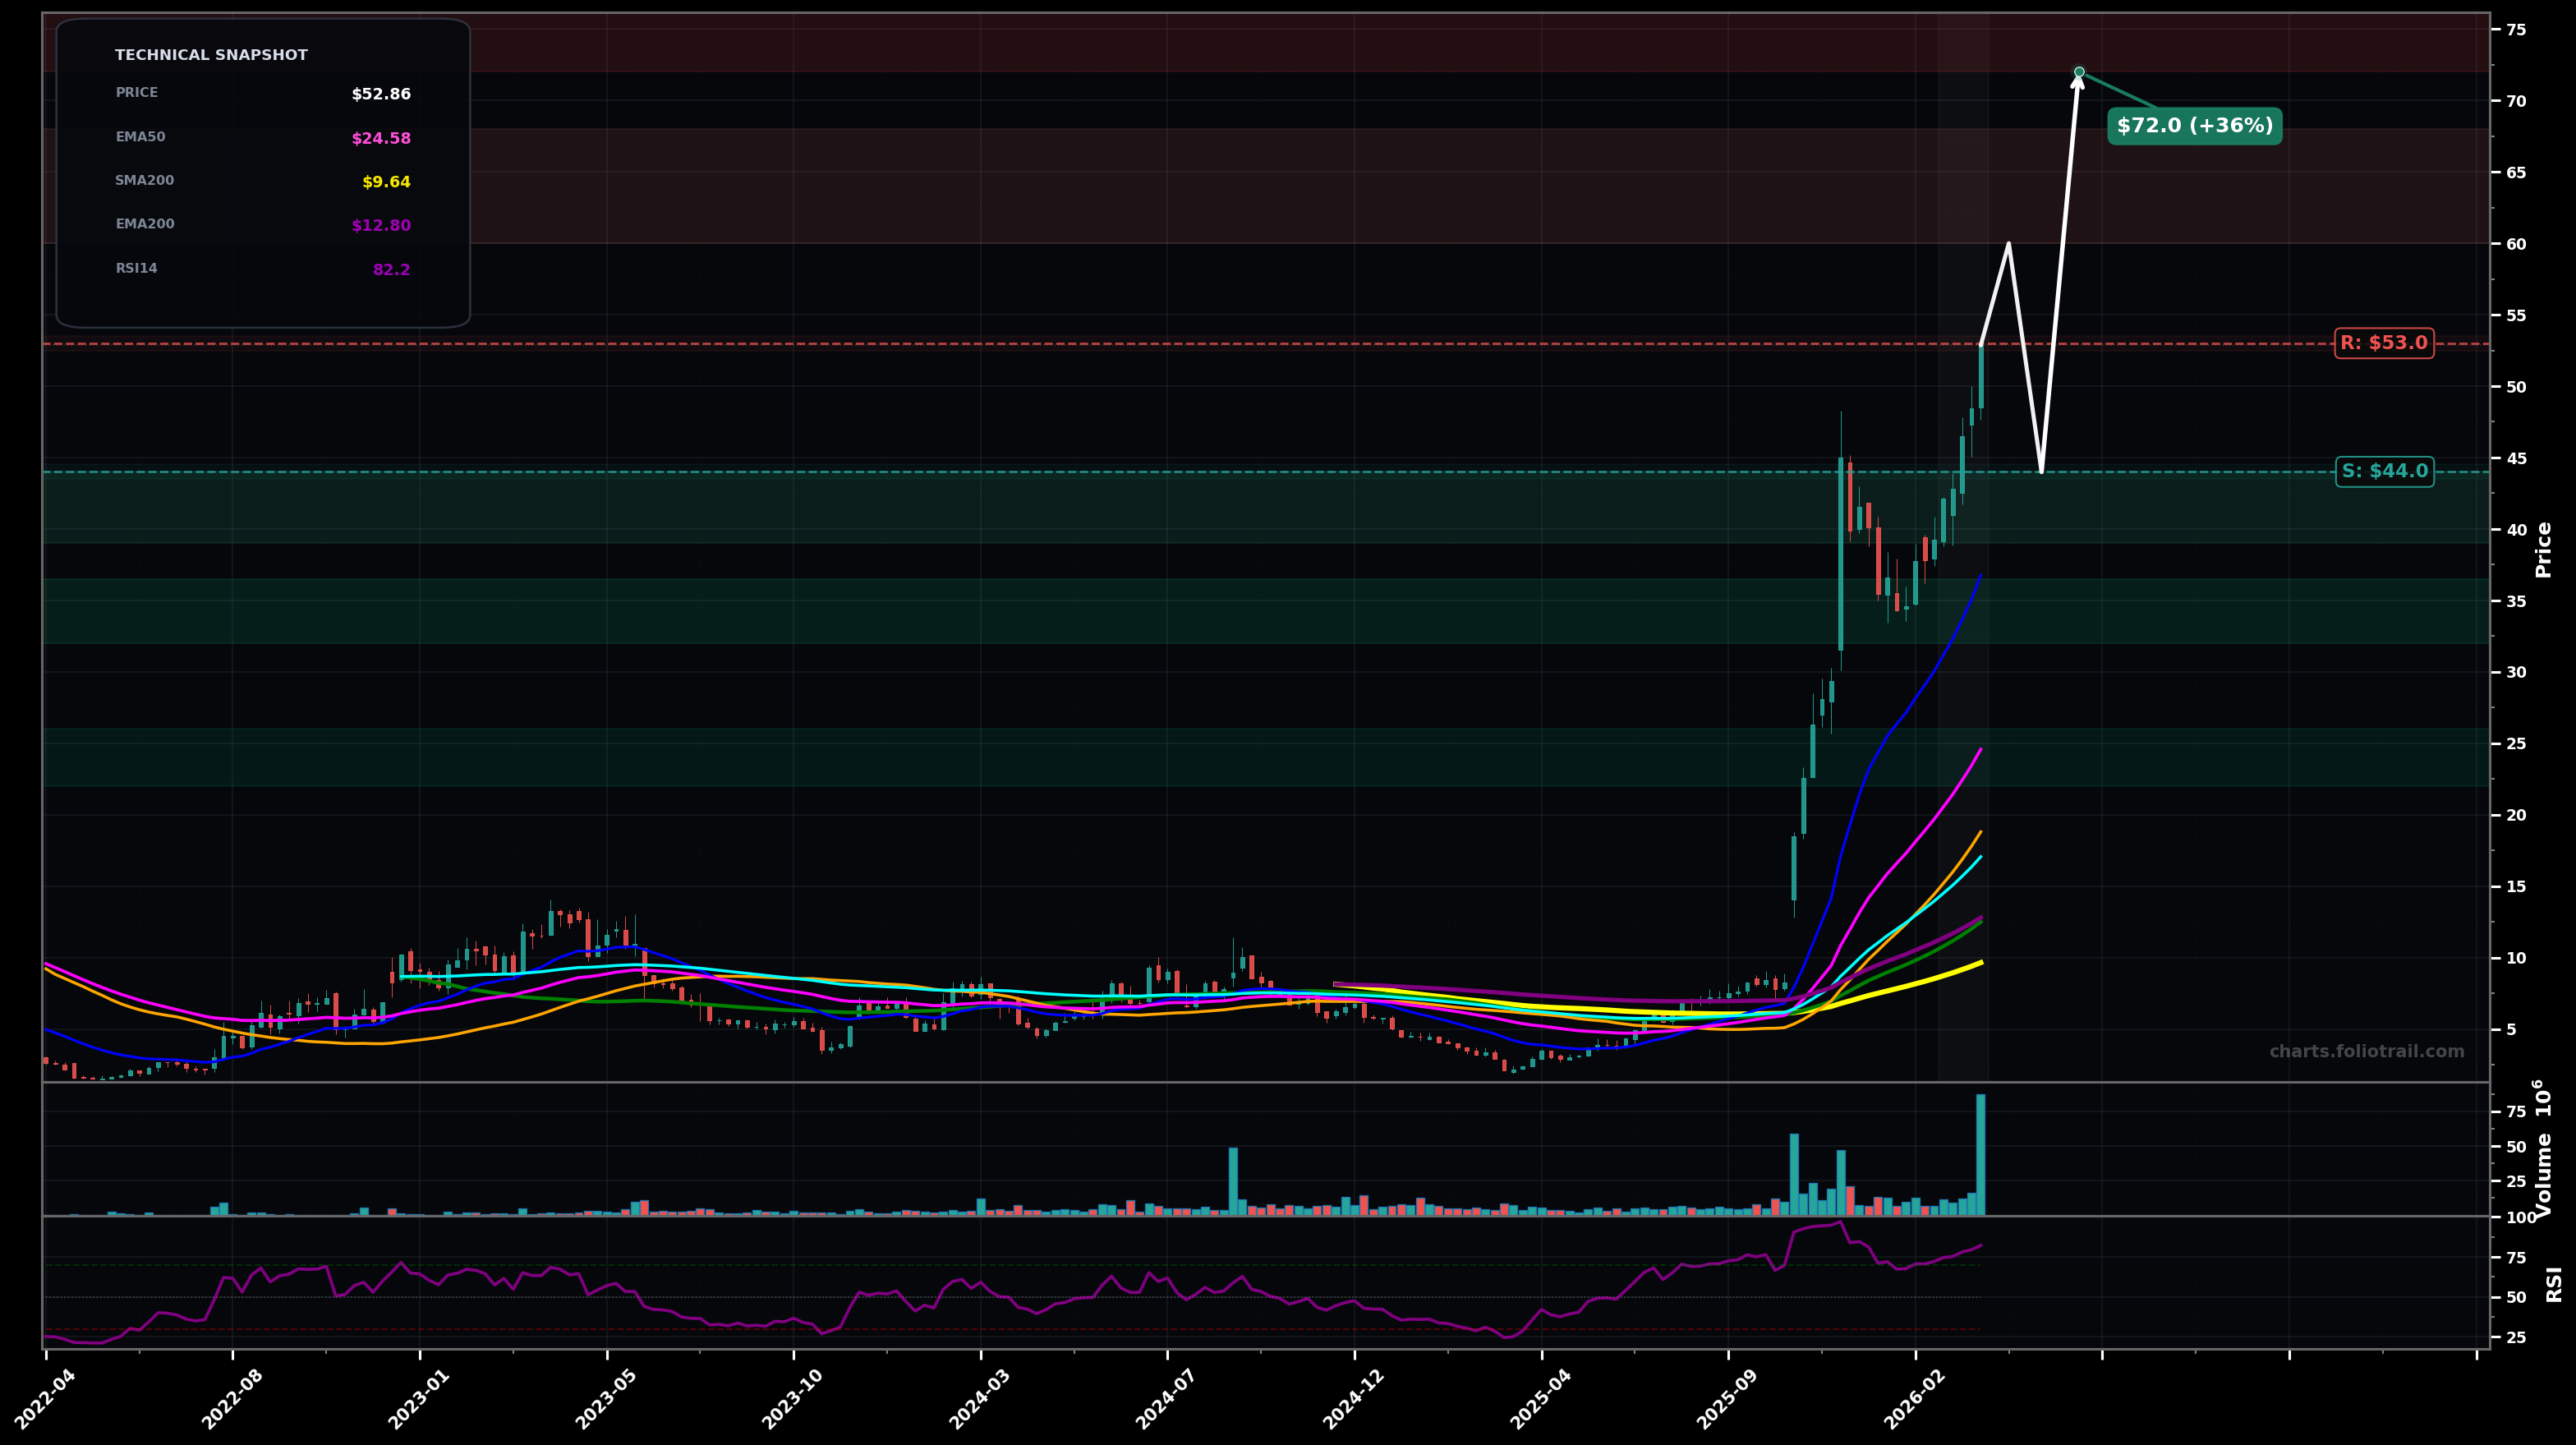
As of March 26, 2026, TERN (Terns Pharmaceuticals, Inc.) is in a parabolic state on the weekly chart, with a confidence level of 74%. Key support is at $44.0 and key resistance at $53.0. Vertical breakout from multi-year base followed by shallow consolidation, then fresh push to new highs; price very extended above all MAs (RSI~82).
Parabolic continuation: brief pullback/sideways digestion above the breakout zone, then continuation to a measured extension; Elliott view: likely late Wave 3 or Wave 5 extension—expect sharp but buyable pullbacks.
Mean-reversion unwind: deeper correction toward fast MAs as momentum cools (RSI compression); Elliott view: an ABC/Wave 4-style correction before another attempt higher.
Hold above $44 on weekly closes (prior breakout/swing area) while making a new HH above $53
Weekly close below $36 (breaks the most recent consolidation HL and opens deeper mean reversion)
Buy-the-dip only: $44-$39 is prior breakout/structure support; $36-$32 aligns with last consolidation floor + likely Fib retrace; $26-$22 is deeper Fib/mean-reversion toward rising EMA50 area if a full Wave-4/ABC develops.
In parabolic runs, trim into upside extensions (Fib/projection zones) because reversals are typically fast; $60-$68 first extension, $72-$85 next extension, $90-$110 extreme blow-off risk zone if momentum persists.
As of March 26, 2026, TERN (Terns Pharmaceuticals, Inc.) is in a parabolic state on the weekly chart with 74% confidence. Vertical breakout from multi-year base followed by shallow consolidation, then fresh push to new highs; price very extended above all MAs (RSI~82).
On the weekly timeframe, TERN has key support at $44.0 and key resistance at $53.0. The most likely scenario (bullish) targets $60.0 and $72.0, with a revert level at $44.0.
TERN (Terns Pharmaceuticals, Inc.) is currently classified as parabolic on the weekly chart, with 74% confidence. Confirmation requires: Hold above $44 on weekly closes (prior breakout/swing area) while making a new HH above $53 This would be invalidated by: Weekly close below $36 (breaks the most recent consolidation HL and opens deeper mean reversion)
The most likely scenario (bullish) targets $60.0 and $72.0, with a revert level at $44.0. The alternative scenario (bearish) targets $36.0 and $25.0.
Multi-layer AI agents analyse 200+ stocks across daily, weekly, and monthly timeframes — producing market state classifications, price scenarios with targets, and position entry/exit levels. Updated every trading day after market close. No paywall. No sign-up required.
Built by Foliotrail.
All content on this website — including charts, analysis, price targets, support/resistance levels, and position zones — is generated entirely by AI and provided for educational and informational purposes only.
This is not financial advice. NEXUSNOIR VENTURES SL (the operator of this website) is not a registered investment adviser or broker-dealer. You should not make investment decisions based solely on this information. Always do your own research and consult a qualified financial advisor.
By continuing, you acknowledge that you have read and agree to our full disclaimer & terms of use and privacy policy.