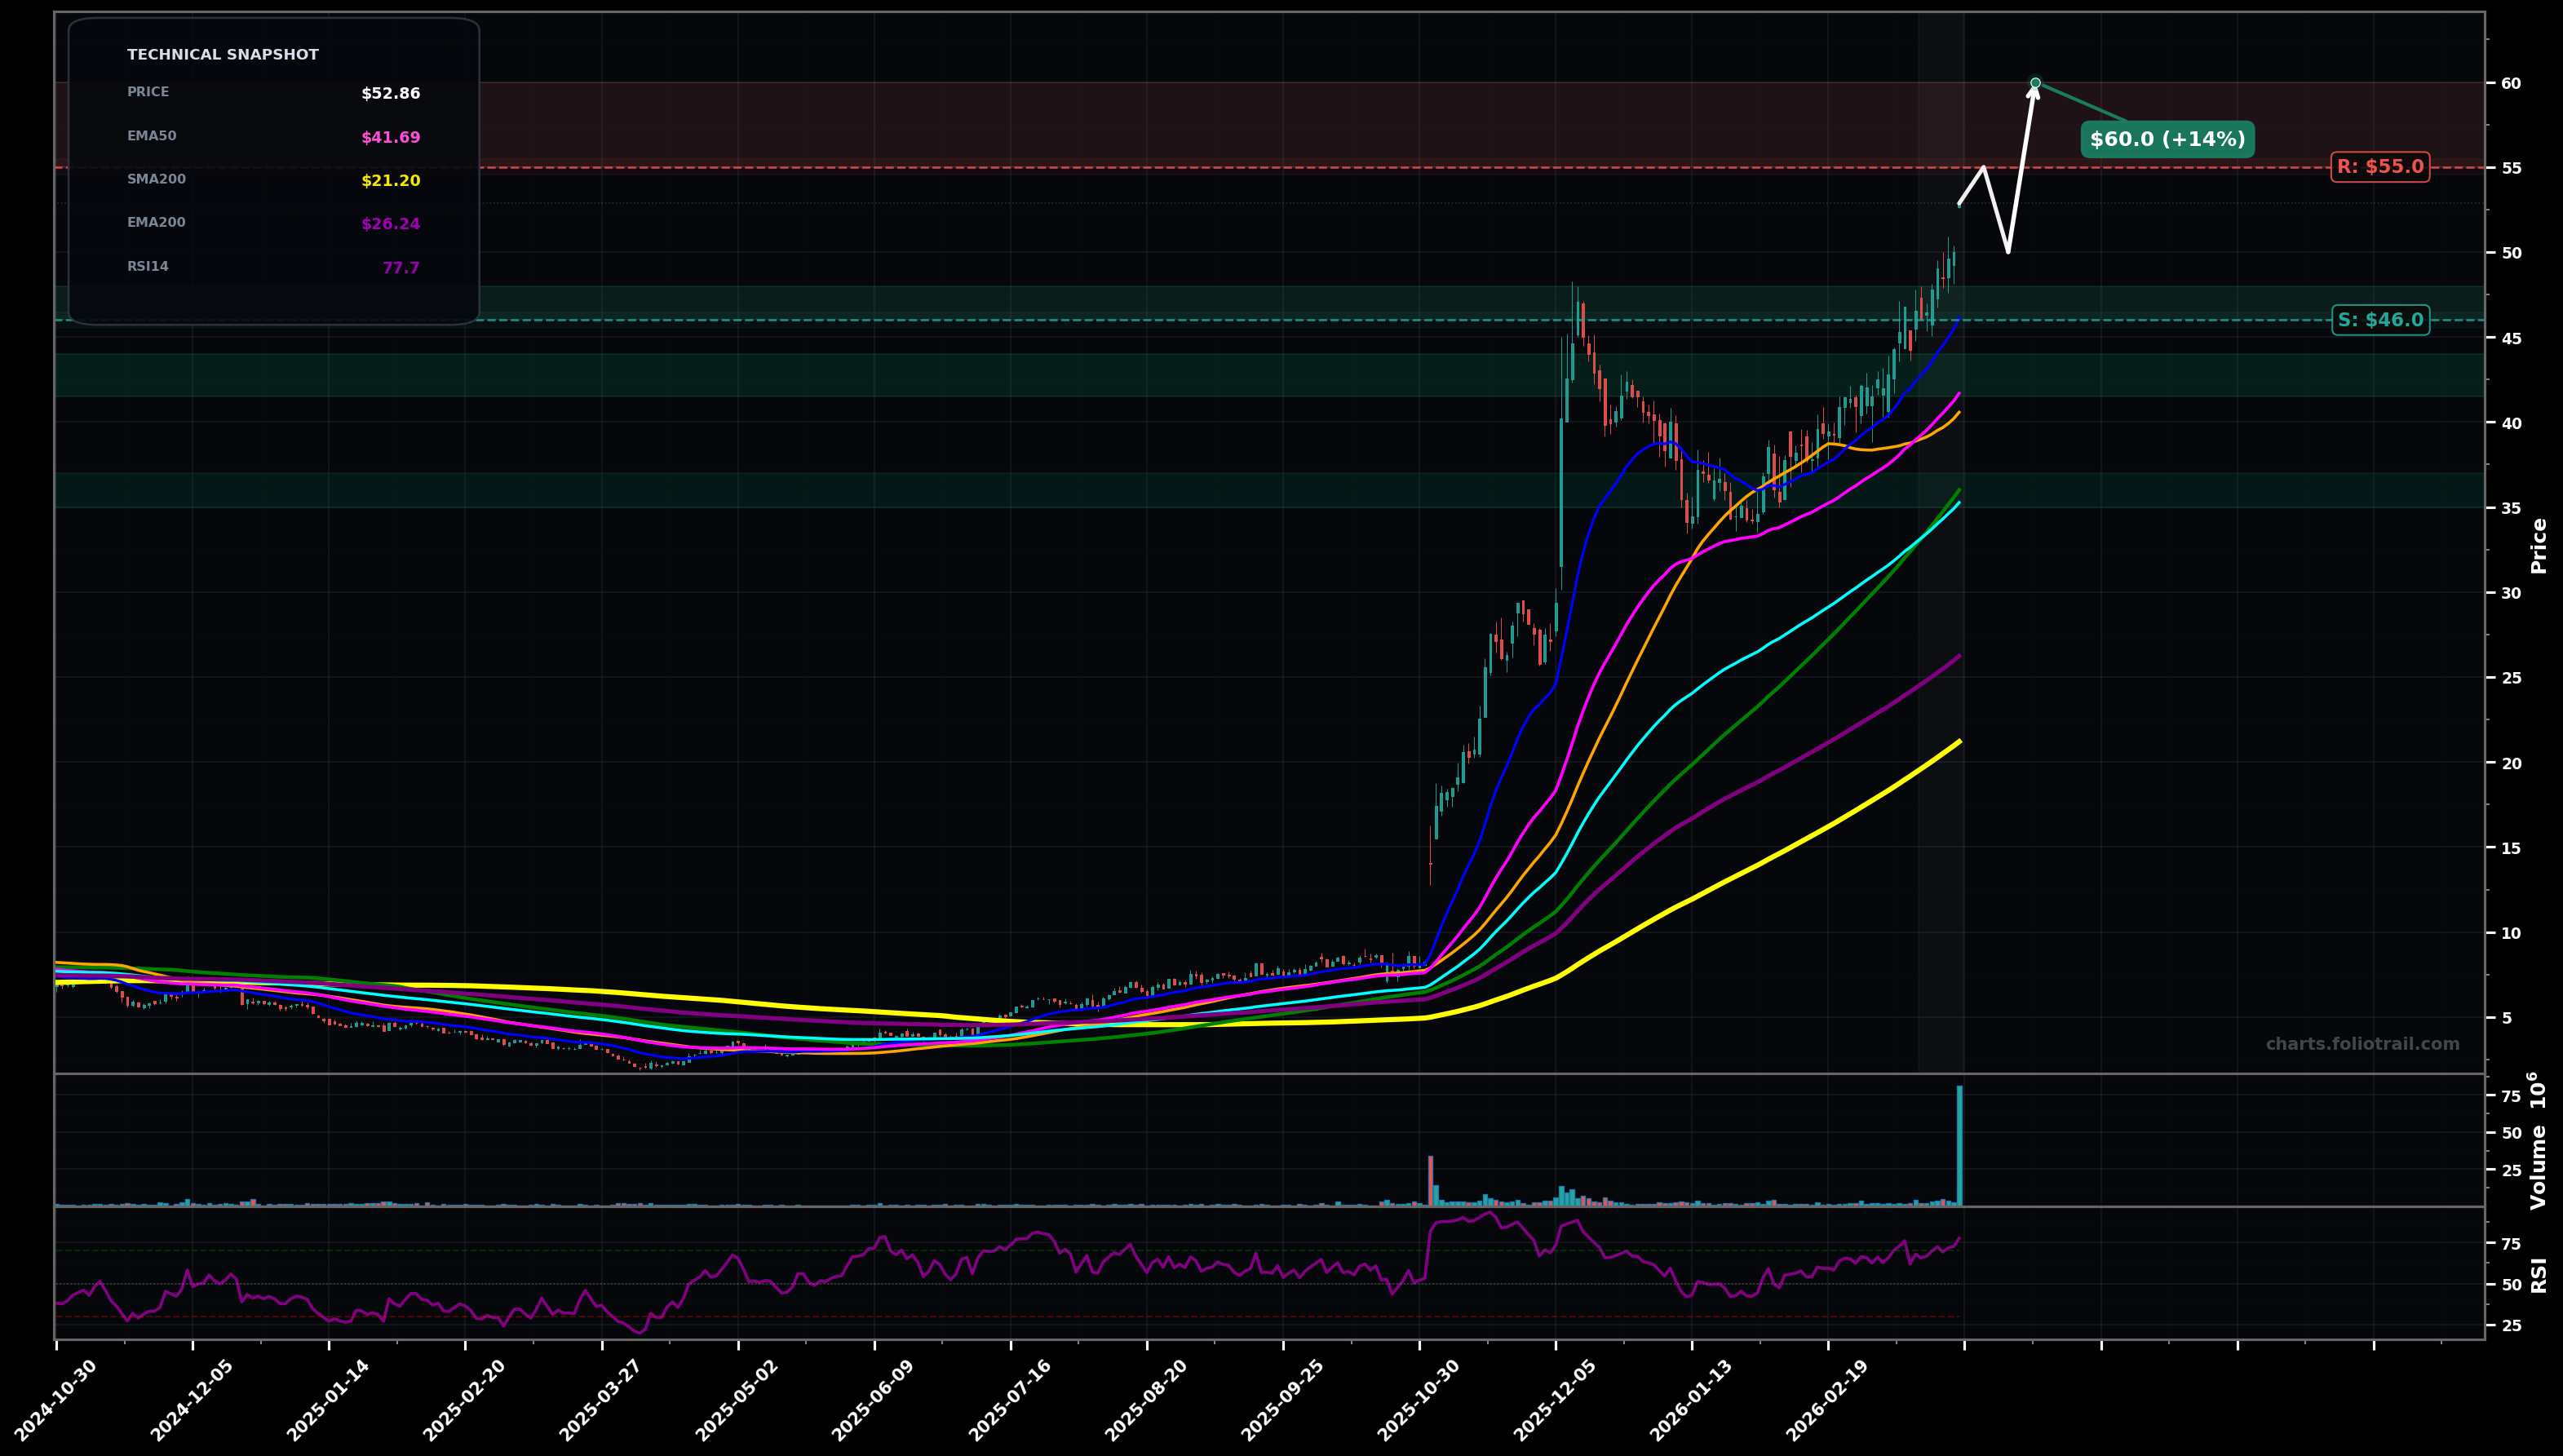
As of March 26, 2026, TERN (Terns Pharmaceuticals, Inc.) is in a parabolic state on the daily chart, with a confidence level of 72%. Key support is at $46.0 and key resistance at $55.0. Price ($52.86) is making fresh HHs with strong follow-through; extended above fast MAs and RSI-14 (~77.7) is overbought while volume just spiked.
Bull continuation: parabolic trend persists and price grinds higher, then pauses into a tight flag rather than a deep pullback (Elliott: extending wave 5 / late wave 3-style stretch).
Mean-reversion pullback: sharp retrace/flush back toward the rising EMA50 then bounce (Elliott: wave 4-type correction after an extended impulse; Fib: typical 0.382–0.5 retrace of the last leg).
Daily close holding above ~$50.00 (prior breakout/psych level) for 2+ sessions
Daily close below ~$46.00 (EMA20 area) would signal momentum break and likely deeper mean reversion
Buy-the-dip zones keyed to dynamic supports: EMA20/structure (~$46), EMA50/SMA50 confluence (~$42–$44), then EMA100/SMA100 area (~$35–$37) if a deeper wave-4 style correction unfolds.
As price gets increasingly stretched above EMA50/100 with RSI elevated, probabilities favor volatility and larger drawdowns—trim into extensions ($55–$70) and consider full exit on euphoric blow-off extensions ($70+).
As of March 26, 2026, TERN (Terns Pharmaceuticals, Inc.) is in a parabolic state on the daily chart with 72% confidence. Price ($52.86) is making fresh HHs with strong follow-through; extended above fast MAs and RSI-14 (~77.7) is overbought while volume just spiked.
On the daily timeframe, TERN has key support at $46.0 and key resistance at $55.0. The most likely scenario (bullish) targets $55.0 and $60.0, with a revert level at $50.0.
TERN (Terns Pharmaceuticals, Inc.) is currently classified as parabolic on the daily chart, with 72% confidence. Confirmation requires: Daily close holding above ~$50.00 (prior breakout/psych level) for 2+ sessions This would be invalidated by: Daily close below ~$46.00 (EMA20 area) would signal momentum break and likely deeper mean reversion
The most likely scenario (bullish) targets $55.0 and $60.0, with a revert level at $50.0. The alternative scenario (bearish) targets $46.0 and $41.5.
Multi-layer AI agents analyse 200+ stocks across daily, weekly, and monthly timeframes — producing market state classifications, price scenarios with targets, and position entry/exit levels. Updated every trading day after market close. No paywall. No sign-up required.
Built by Foliotrail.
All content on this website — including charts, analysis, price targets, support/resistance levels, and position zones — is generated entirely by AI and provided for educational and informational purposes only.
This is not financial advice. NEXUSNOIR VENTURES SL (the operator of this website) is not a registered investment adviser or broker-dealer. You should not make investment decisions based solely on this information. Always do your own research and consult a qualified financial advisor.
By continuing, you acknowledge that you have read and agree to our full disclaimer & terms of use and privacy policy.