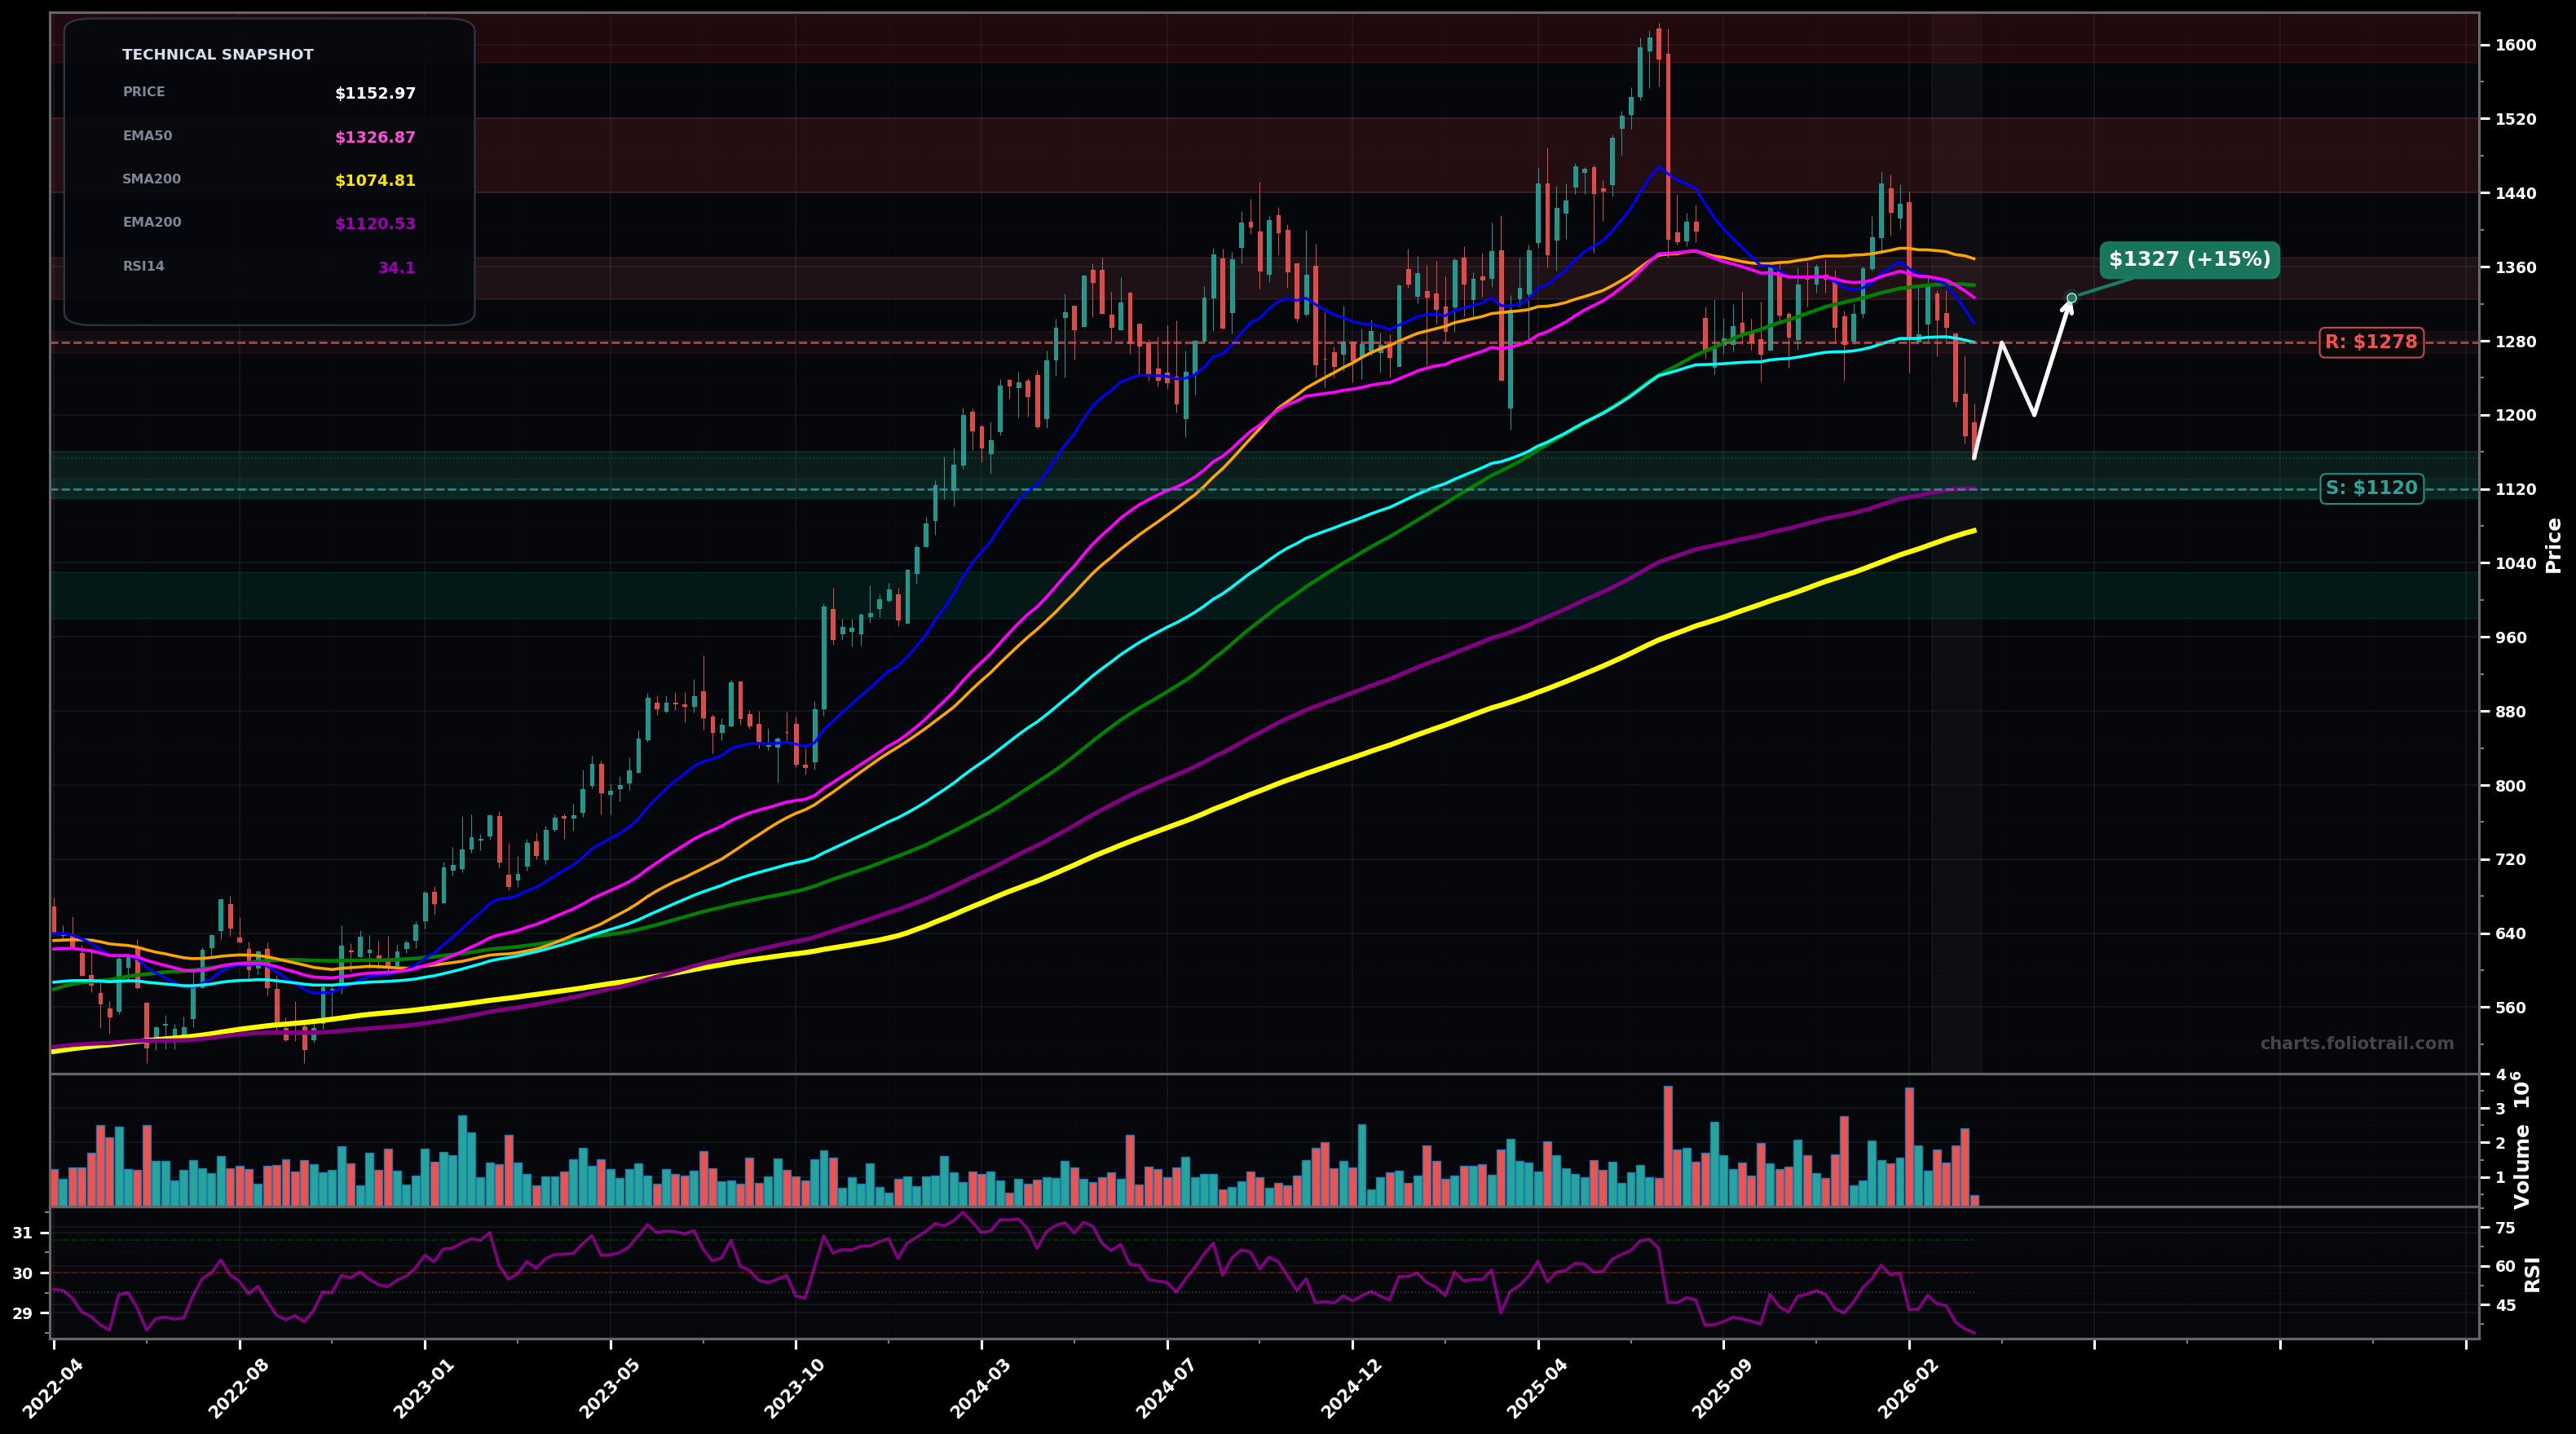
As of March 24, 2026, TDG (TransDigm Group Inc.) is in a downtrend state on the weekly chart, with a confidence level of 72%. Key support is at $1120 and key resistance at $1278. Weekly selloff with a breakdown below the EMA50 ($1326.87) and EMA100 ($1278.31); price now near the EMA200 ($1120.53) with RSI-14 at 34.11 (weak momentum, near-oversold).
Support-test then bounce: price tags the EMA200/$1120 area and attempts a reflex rally into the prior breakdown zone (EMA100/EMA50 cluster).
Breakdown continuation: a decisive weekly close under the EMA200 ($1120) triggers the next leg down toward the long-term SMA200 area.
Weekly close below $1120 (EMA200) would confirm the downtrend continuation.
Weekly close back above $1278 (EMA100) would invalidate the immediate bearish control.
Scale-in around EMA200 support first, add if breakdown reaches SMA200 ($1074.81), heavy add near the psychological $1000 area if capitulation extends.
Trim into MA-reclaim rallies (EMA50/SMA50 zone), trim more near prior supply pivots, and consider full exit near the previous major top region where distribution previously started.
As of March 24, 2026, TDG (TransDigm Group Inc.) is in a downtrend state on the weekly chart with 72% confidence. Weekly selloff with a breakdown below the EMA50 ($1326.87) and EMA100 ($1278.31); price now near the EMA200 ($1120.53) with RSI-14 at 34.11 (weak momentum, near-oversold).
On the weekly timeframe, TDG has key support at $1120 and key resistance at $1278. The most likely scenario (bullish) targets $1278 and $1327, with a revert level at $1200.
TDG (TransDigm Group Inc.) is currently classified as downtrend on the weekly chart, with 72% confidence. Confirmation requires: Weekly close below $1120 (EMA200) would confirm the downtrend continuation. This would be invalidated by: Weekly close back above $1278 (EMA100) would invalidate the immediate bearish control.
The most likely scenario (bullish) targets $1278 and $1327, with a revert level at $1200. The alternative scenario (bearish) targets $1075 and $1000.
All content on this website — including charts, analysis, price targets, support/resistance levels, and position zones — is generated entirely by AI and provided for educational and informational purposes only.
This is not financial advice. NEXUSNOIR VENTURES SL (the operator of this website) is not a registered investment adviser or broker-dealer. You should not make investment decisions based solely on this information. Always do your own research and consult a qualified financial advisor.
By continuing, you acknowledge that you have read and agree to our full disclaimer & terms of use and privacy policy.