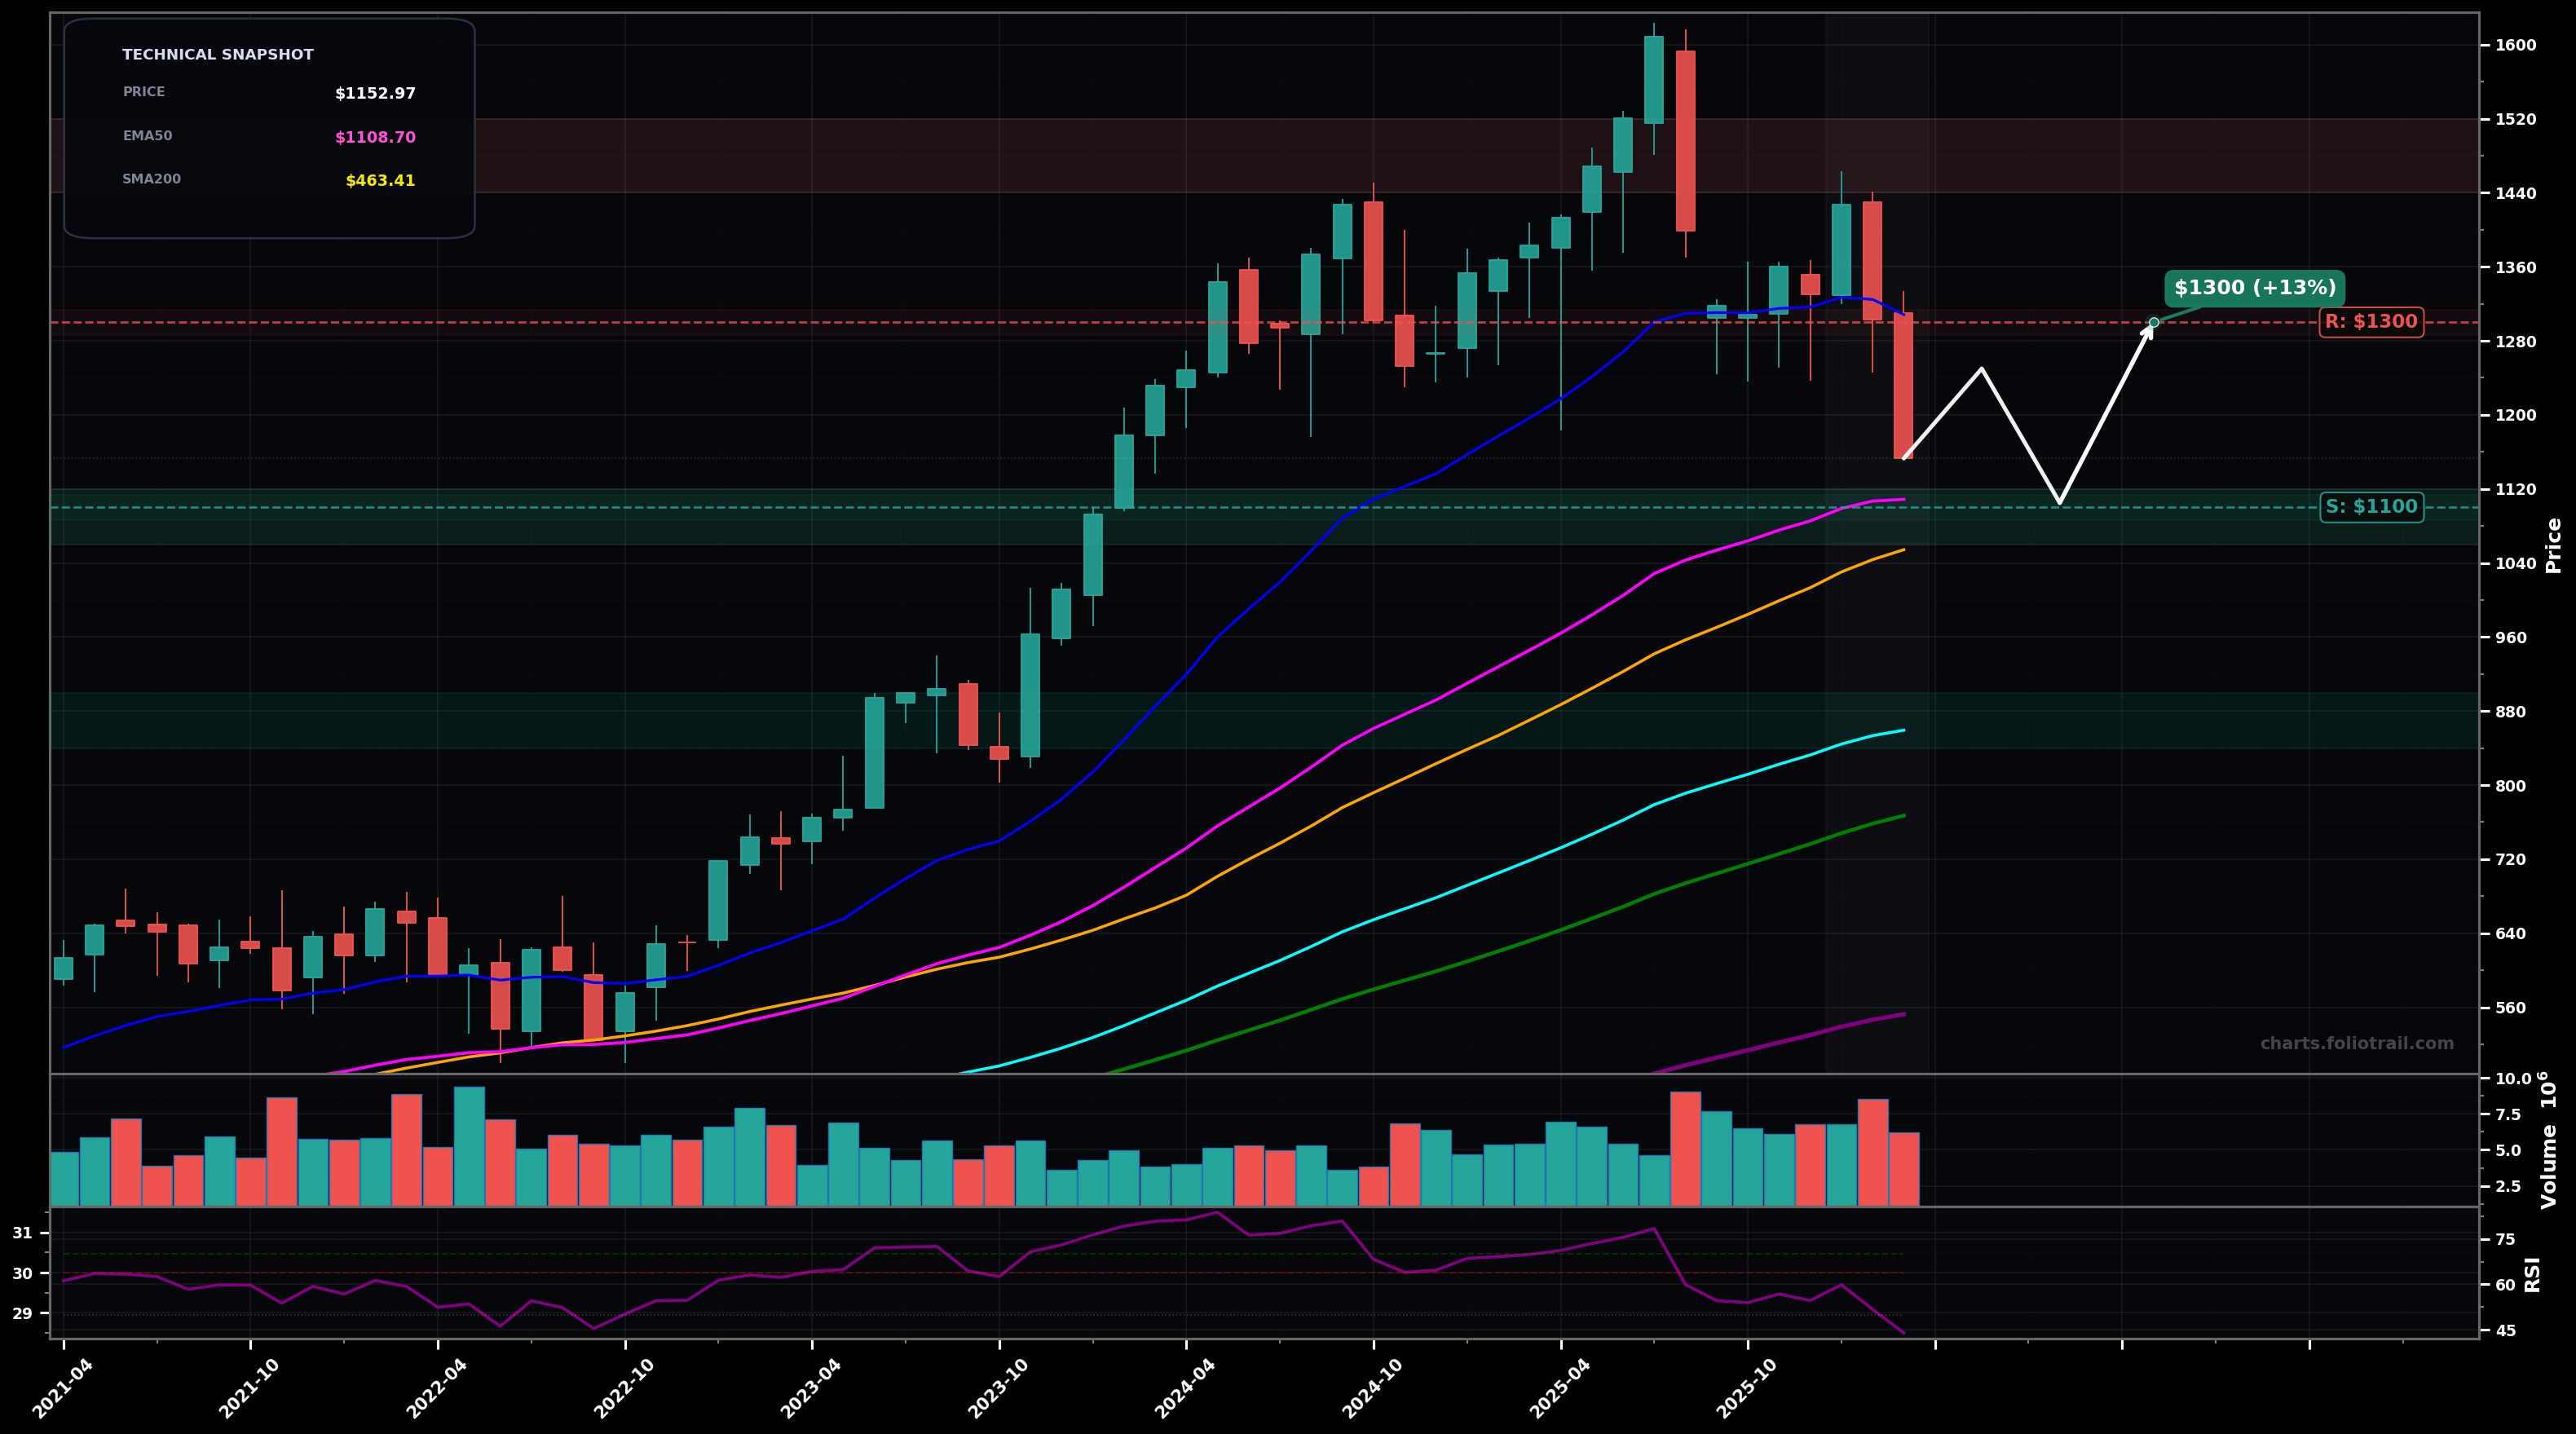
As of March 24, 2026, TDG (TransDigm Group Inc.) is in a volatility expansion state on the monthly chart, with a confidence level of 62%. Key support is at $1100 and key resistance at $1300. Monthly chart shows a sharp sell candle that lost the prior consolidation area and pushed price back under the fast trend line (blue/shorter MA), while still holding above the rising EMA50 (pink) and SMA50 (orange).
Mean-reversion pullback into the rising EMA50/SMA50 cluster, then an attempt to base: buyers defend $1100-$1055; a relief bounce can retest $1250-$1300 before a second leg decides trend.
Deeper correction: failure to hold $1100 leads to a flush into the next higher-timeframe supports (EMA100 cyan ~$860), consistent with an Elliott Wave ABC where C extends.
Volatility-expansion bearish leg confirmed on a monthly close below $1100 with follow-through toward $1055 (SMA50).
This turns into a bullish reset if price reclaims and closes back above $1300 (fast MA zone) for 2+ months.
Start near EMA50/SMA50 confluence ($1108/$1054); add if breakdown tests prior structure around $1k; heavy add near EMA100 ($859) where Wave-4/ABC corrections often terminate on monthly trends.
Trim into prior swing-high supply ($1440-$1600) and close if price becomes materially extended above rising MAs (late-cycle Wave-5 risk) after reclaiming highs.
As of March 24, 2026, TDG (TransDigm Group Inc.) is in a volatility expansion state on the monthly chart with 62% confidence. Monthly chart shows a sharp sell candle that lost the prior consolidation area and pushed price back under the fast trend line (blue/shorter MA), while still holding above the rising EMA50 (pink) and SMA50 (orange).
On the monthly timeframe, TDG has key support at $1100 and key resistance at $1300. The most likely scenario (bullish) targets $1250 and $1300, with a revert level at $1105.
TDG (TransDigm Group Inc.) is currently classified as volatility expansion on the monthly chart, with 62% confidence. Confirmation requires: Volatility-expansion bearish leg confirmed on a monthly close below $1100 with follow-through toward $1055 (SMA50). This would be invalidated by: This turns into a bullish reset if price reclaims and closes back above $1300 (fast MA zone) for 2+ months.
The most likely scenario (bullish) targets $1250 and $1300, with a revert level at $1105. The alternative scenario (bearish) targets $1055 and $860.
All content on this website — including charts, analysis, price targets, support/resistance levels, and position zones — is generated entirely by AI and provided for educational and informational purposes only.
This is not financial advice. NEXUSNOIR VENTURES SL (the operator of this website) is not a registered investment adviser or broker-dealer. You should not make investment decisions based solely on this information. Always do your own research and consult a qualified financial advisor.
By continuing, you acknowledge that you have read and agree to our full disclaimer & terms of use and privacy policy.