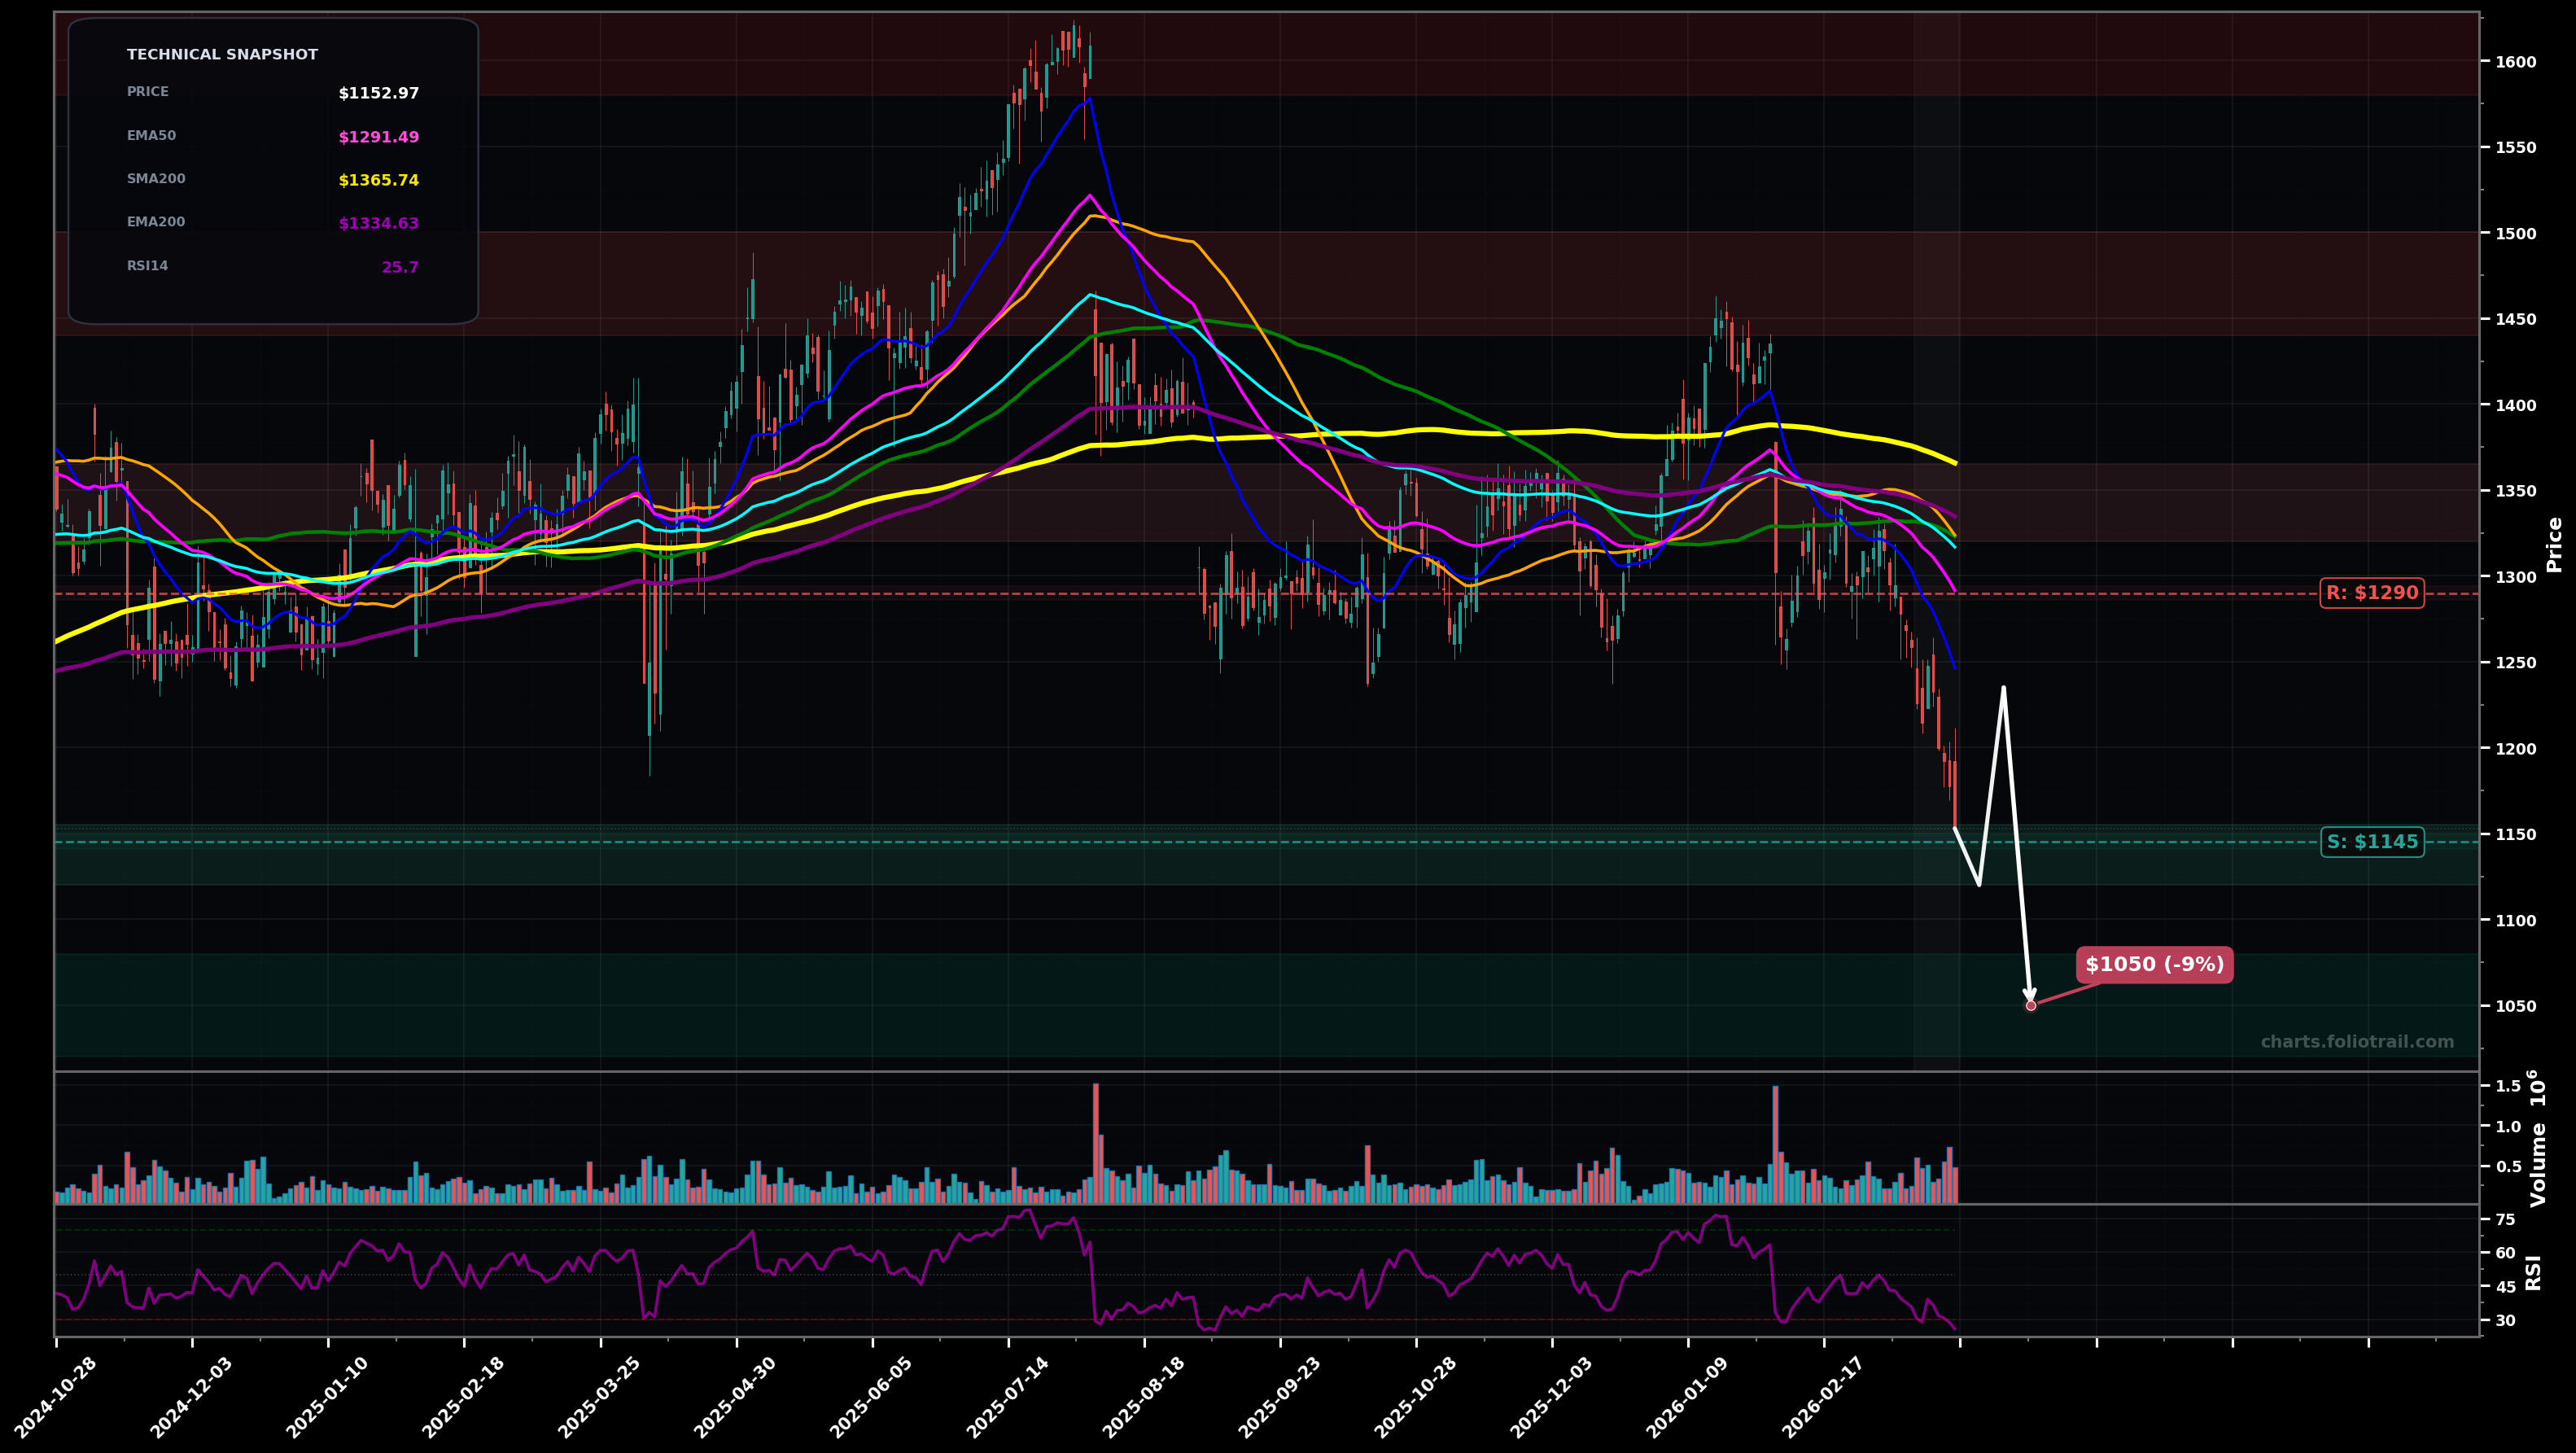
As of March 24, 2026, TDG (TransDigm Group Inc.) is in a falling knife state on the daily chart, with a confidence level of 78%. Key support is at $1145 and key resistance at $1290. Sharp selloff with consecutive red candles; price at ~$1152.97 well below EMA50/EMA100 and breaking recent swing supports; RSI deeply oversold (~25.7).
Dead-cat bounce from the $1145± area, then failure under the EMA50/EMA100 cluster and a continuation leg lower (typical wave-3/5 continuation behavior after a breakdown).
Capitulation low forms (momentum exhausts with RSI oversold), followed by an ABC corrective rally that reclaims EMA50 and tests the heavy MA supply near the $1320-$1365 band (EMA100/SMA50/SMA200 area).
Daily close below $1145 would confirm continued falling-knife pressure toward the next demand pocket.
Two daily closes back above $1290 (EMA50 zone) would invalidate the falling-knife call and shift to bottoming attempt/bounce structure.
Scale near current breakdown support ($1145) then deeper demand pockets; add more only if selloff extends while RSI stays washed out and price nears prior consolidation bases/Fib extension zones.
Trim into overhead MA supply first (EMA100/SMA50/SMA200 cluster), then prior swing resistance zones; fully exit if price revisits prior peak-area extensions where upside becomes asymmetrically stretched.
As of March 24, 2026, TDG (TransDigm Group Inc.) is in a falling knife state on the daily chart with 78% confidence. Sharp selloff with consecutive red candles; price at ~$1152.97 well below EMA50/EMA100 and breaking recent swing supports; RSI deeply oversold (~25.7).
On the daily timeframe, TDG has key support at $1145 and key resistance at $1290. The most likely scenario (bearish) targets $1120 and $1050, with a revert level at $1235.
TDG (TransDigm Group Inc.) is currently classified as falling knife on the daily chart, with 78% confidence. Confirmation requires: Daily close below $1145 would confirm continued falling-knife pressure toward the next demand pocket. This would be invalidated by: Two daily closes back above $1290 (EMA50 zone) would invalidate the falling-knife call and shift to bottoming attempt/bounce structure.
The most likely scenario (bearish) targets $1120 and $1050, with a revert level at $1235. The alternative scenario (bullish) targets $1290 and $1365.
All content on this website — including charts, analysis, price targets, support/resistance levels, and position zones — is generated entirely by AI and provided for educational and informational purposes only.
This is not financial advice. NEXUSNOIR VENTURES SL (the operator of this website) is not a registered investment adviser or broker-dealer. You should not make investment decisions based solely on this information. Always do your own research and consult a qualified financial advisor.
By continuing, you acknowledge that you have read and agree to our full disclaimer & terms of use and privacy policy.