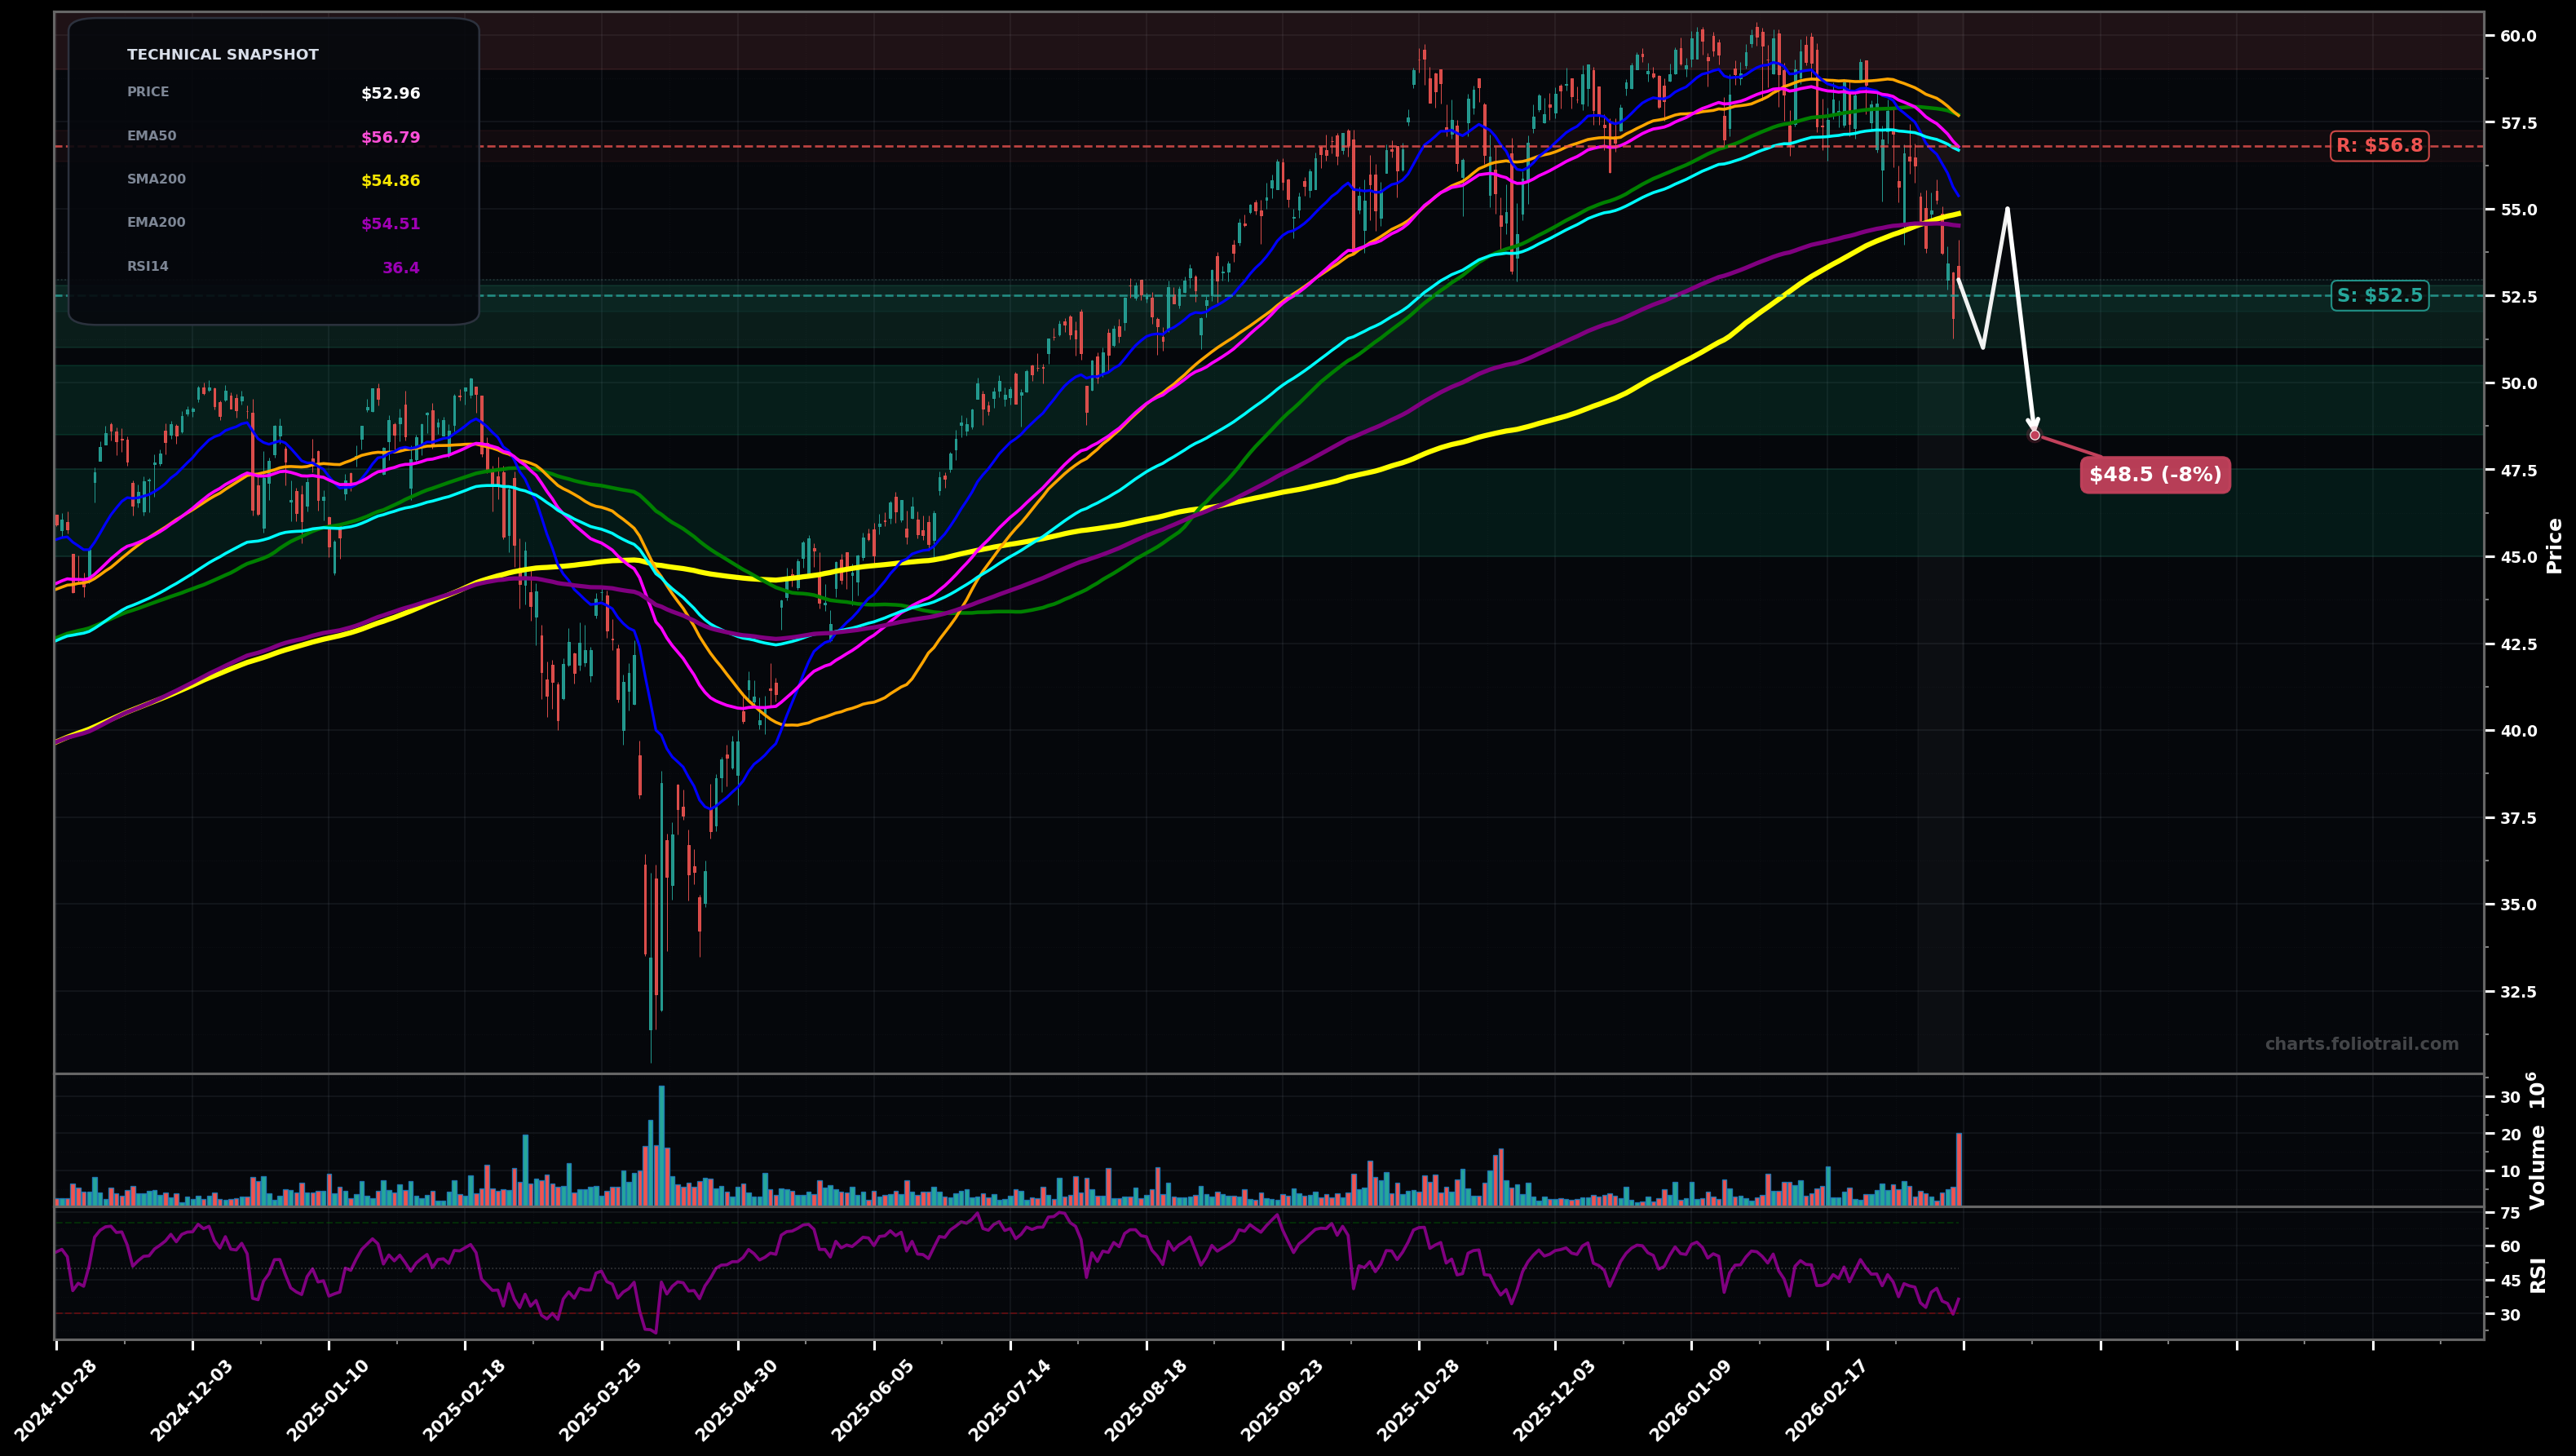
As of March 24, 2026, SSO (ProShares Ultra S&P500) is in a downtrend state on the daily chart, with a confidence level of 73%. Key support is at $52.5 and key resistance at $56.8. Sharp selloff from the $59-$60 range with a large breakdown candle; price now ~$52.96 under EMA50/EMA100 and near/below the SMA200 with RSI ~36 (weak momentum).
Bearish continuation: weak bounce/flag fails below the EMA50/100 zone, then price grinds lower to test the SMA200/major support band and possibly undercut it before stabilizing.
Bullish mean-reversion: price holds the $52-$53 swing area, forms a higher low, then reclaims EMA50/EMA100 leading to a move back into the prior range (late-stage wave-4 style pullback resolving upward).
Daily close below $52.50 (with follow-through) confirms continued downtrend pressure toward the next supports.
Two daily closes back above $56.80 (reclaim EMA50/EMA100 zone) would invalidate the immediate downtrend and shift to a reversal/base scenario.
Scale bids at prior swing support and likely Fib retracement zones of the 2025–2026 advance; heavier adds only if a deeper flush toward the mid-$40s occurs (closer to long MAs/major prior structure).
Trim into prior highs/extension zones (typical Elliott wave 5 / Fib extensions) where upside gets stretched and pullback risk increases; fully exit only on extreme multi-year extension.
As of March 24, 2026, SSO (ProShares Ultra S&P500) is in a downtrend state on the daily chart with 73% confidence. Sharp selloff from the $59-$60 range with a large breakdown candle; price now ~$52.96 under EMA50/EMA100 and near/below the SMA200 with RSI ~36 (weak momentum).
On the daily timeframe, SSO has key support at $52.5 and key resistance at $56.8. The most likely scenario (bearish) targets $51.0 and $48.5, with a revert level at $55.0.
SSO (ProShares Ultra S&P500) is currently classified as downtrend on the daily chart, with 73% confidence. Confirmation requires: Daily close below $52.50 (with follow-through) confirms continued downtrend pressure toward the next supports. This would be invalidated by: Two daily closes back above $56.80 (reclaim EMA50/EMA100 zone) would invalidate the immediate downtrend and shift to a reversal/base scenario.
The most likely scenario (bearish) targets $51.0 and $48.5, with a revert level at $55.0. The alternative scenario (bullish) targets $56.8 and $59.5.
All content on this website — including charts, analysis, price targets, support/resistance levels, and position zones — is generated entirely by AI and provided for educational and informational purposes only.
This is not financial advice. NEXUSNOIR VENTURES SL (the operator of this website) is not a registered investment adviser or broker-dealer. You should not make investment decisions based solely on this information. Always do your own research and consult a qualified financial advisor.
By continuing, you acknowledge that you have read and agree to our full disclaimer & terms of use and privacy policy.