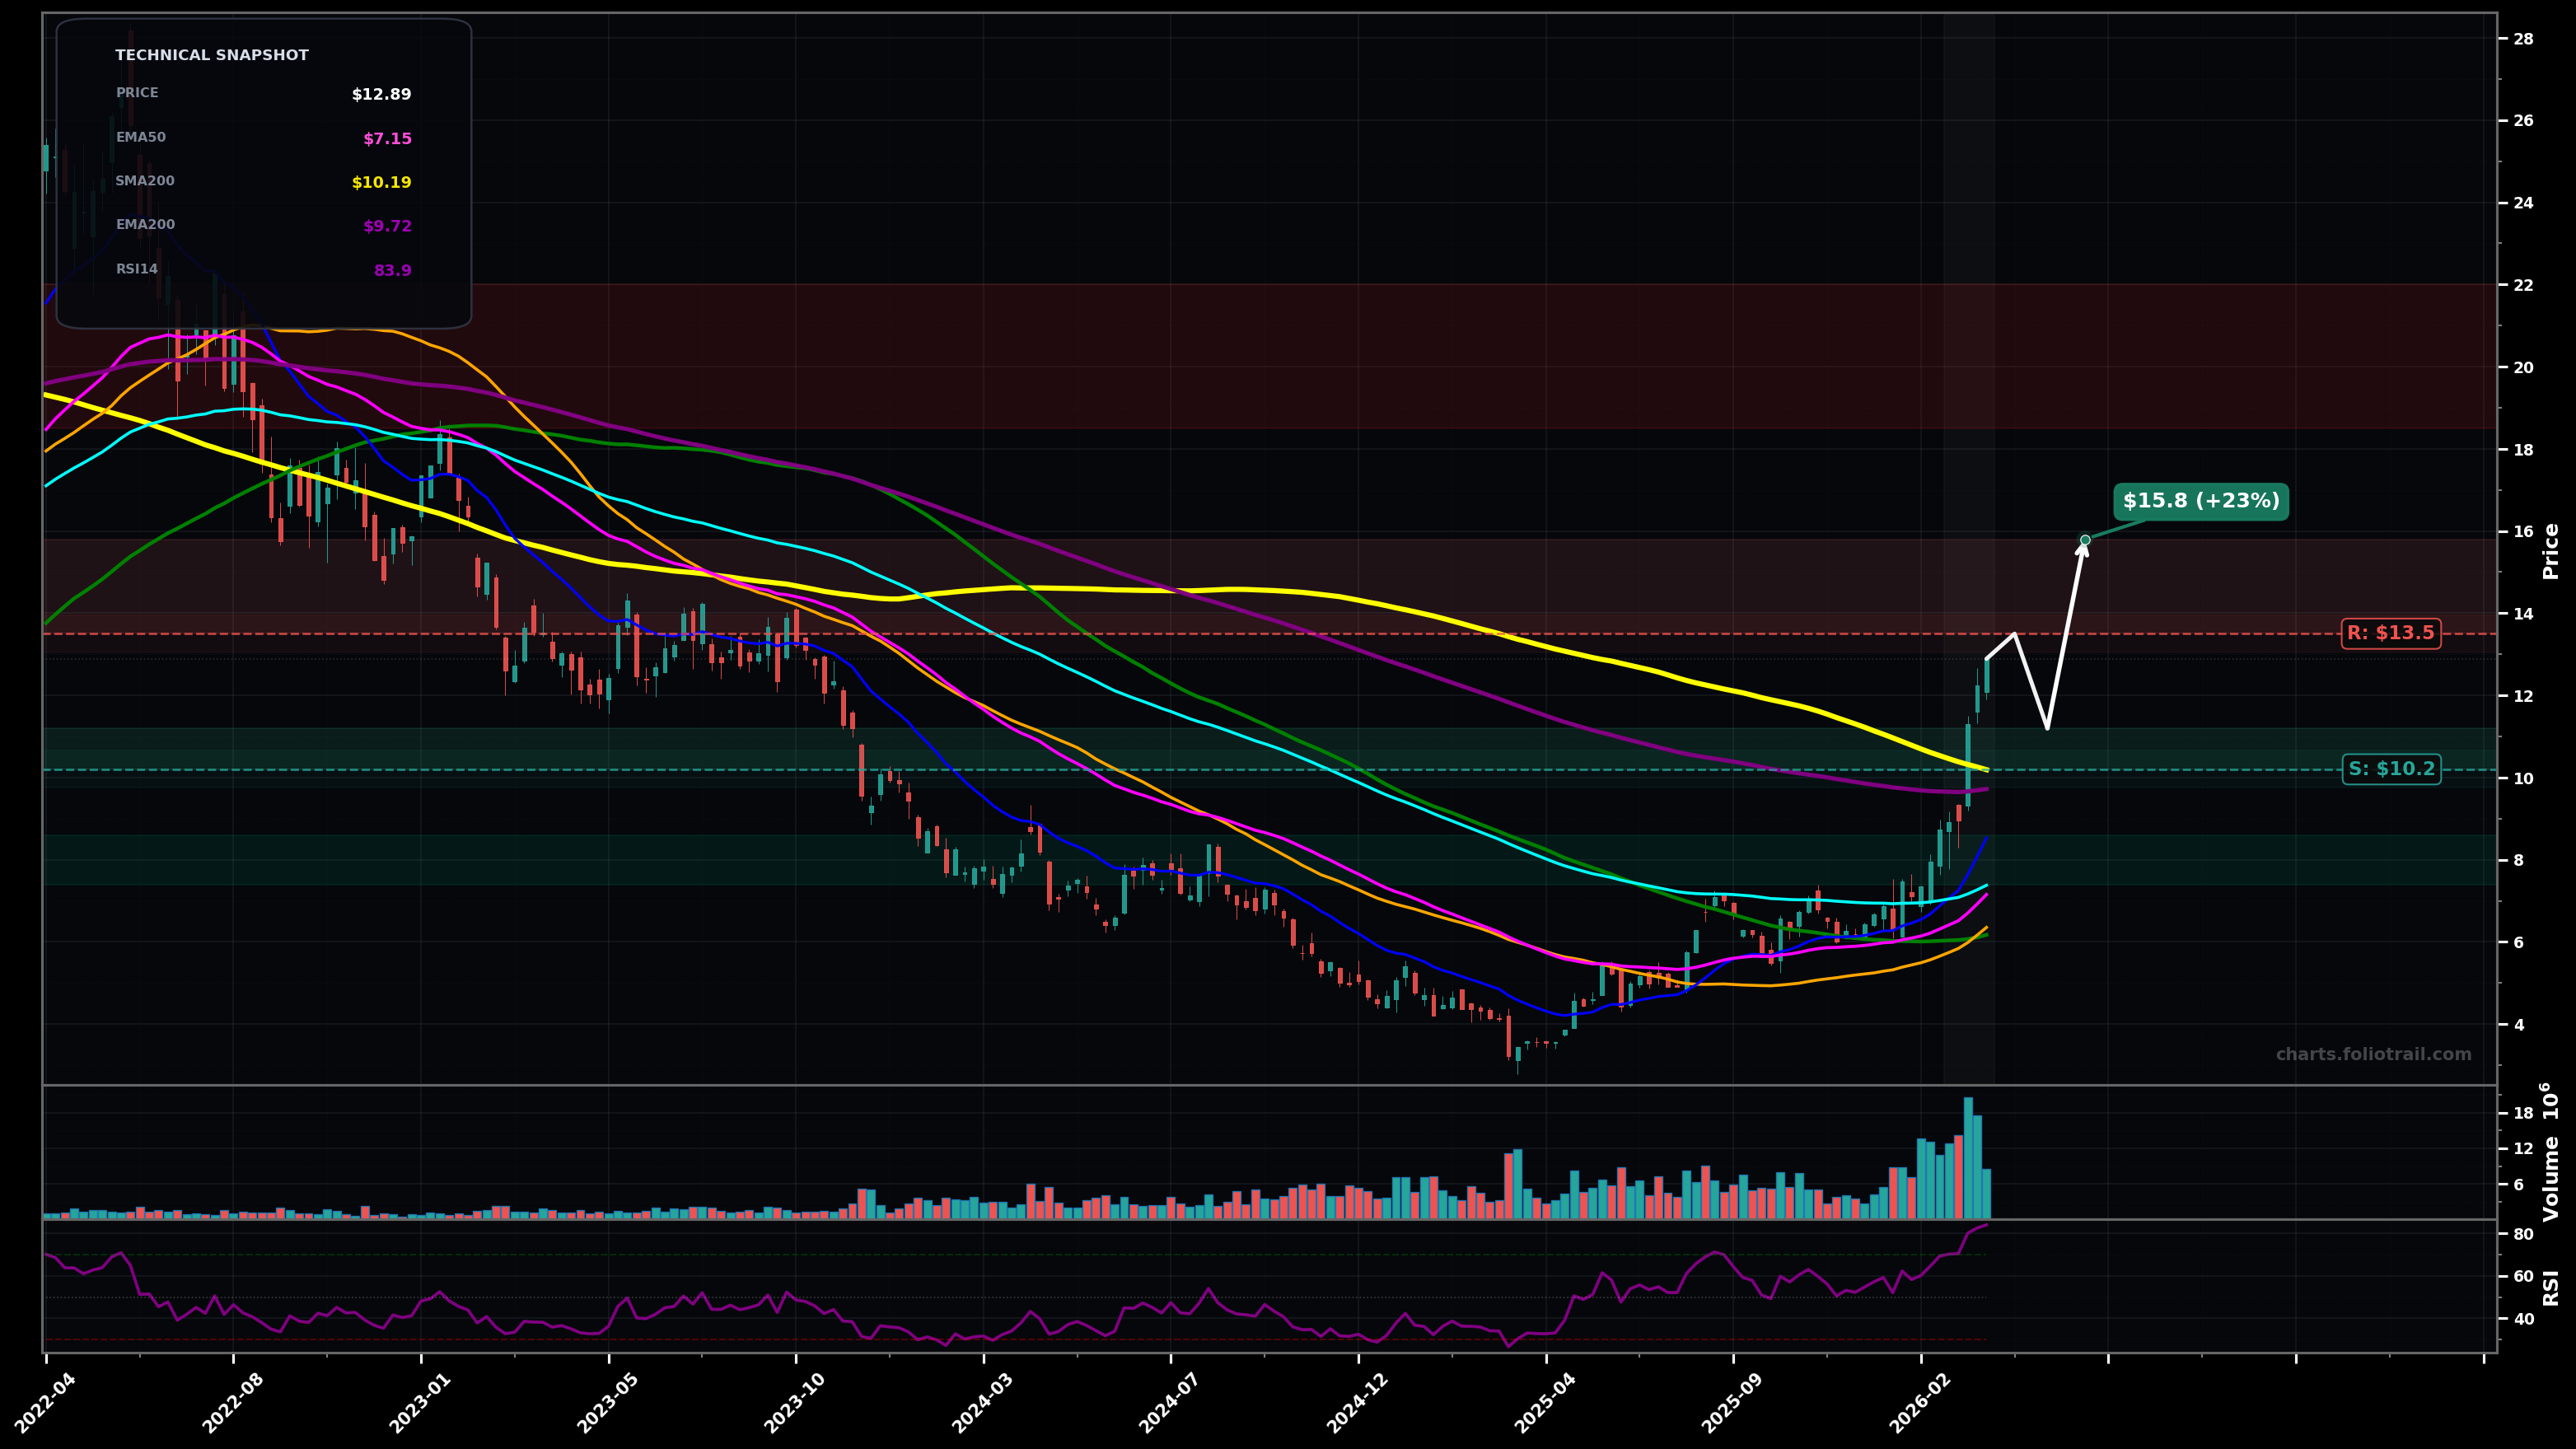
As of March 26, 2026, SSL (Sasol Ltd Sponsored ADR) is in a breakout reversal state on the weekly chart, with a confidence level of 72%. Key support is at $10.2 and key resistance at $13.5. Sharp weekly breakout with expanding volume; price $12.89 has cleared the long-downtrend MAs cluster and is now pressing into the SMA200 (~$10.19) area from above; RSI(14) is very overbought (~84) implying pullback risk.
Bullish continuation after a brief digestion: pullback/retest toward the $11.20–$10.20 breakout zone, then resume higher as former resistance turns support (trend-change confirmation).
Bearish mean-reversion: overbought weekly RSI triggers a deeper retrace, failing to hold the $10.20 reclaim and sliding back into the prior range before any new attempt higher.
Weekly close(s) holding above $10.20 (SMA200 reclaimed) with no breakdown back under it.
Weekly close back below $9.70 (loss of reclaimed SMA200 zone) would negate the breakout-reversal read.
Buy-the-retest framework: first add on SMA200/round-number support, add more on failed retest but still above prior base, heavy add only if price mean-reverts to EMA50/EMA100 cluster (~$7.1–$7.4).
Trim into strength at prior swing-supply/extension zones: first at immediate breakout extension, more if price stretches far above SMA200 with RSI elevated, and fully exit only if a parabolic extension into major multi-year resistance appears.
As of March 26, 2026, SSL (Sasol Ltd Sponsored ADR) is in a breakout reversal state on the weekly chart with 72% confidence. Sharp weekly breakout with expanding volume; price $12.89 has cleared the long-downtrend MAs cluster and is now pressing into the SMA200 (~$10.19) area from above; RSI(14) is very overbought (~84) implying pullback risk.
On the weekly timeframe, SSL has key support at $10.2 and key resistance at $13.5. The most likely scenario (bullish) targets $13.5 and $15.8, with a revert level at $11.2.
SSL (Sasol Ltd Sponsored ADR) is currently classified as breakout reversal on the weekly chart, with 72% confidence. Confirmation requires: Weekly close(s) holding above $10.20 (SMA200 reclaimed) with no breakdown back under it. This would be invalidated by: Weekly close back below $9.70 (loss of reclaimed SMA200 zone) would negate the breakout-reversal read.
The most likely scenario (bullish) targets $13.5 and $15.8, with a revert level at $11.2. The alternative scenario (bearish) targets $9.70 and $7.40.
Multi-layer AI agents analyse 200+ stocks across daily, weekly, and monthly timeframes — producing market state classifications, price scenarios with targets, and position entry/exit levels. Updated every trading day after market close. No paywall. No sign-up required.
Built by Foliotrail.
All content on this website — including charts, analysis, price targets, support/resistance levels, and position zones — is generated entirely by AI and provided for educational and informational purposes only.
This is not financial advice. NEXUSNOIR VENTURES SL (the operator of this website) is not a registered investment adviser or broker-dealer. You should not make investment decisions based solely on this information. Always do your own research and consult a qualified financial advisor.
By continuing, you acknowledge that you have read and agree to our full disclaimer & terms of use and privacy policy.