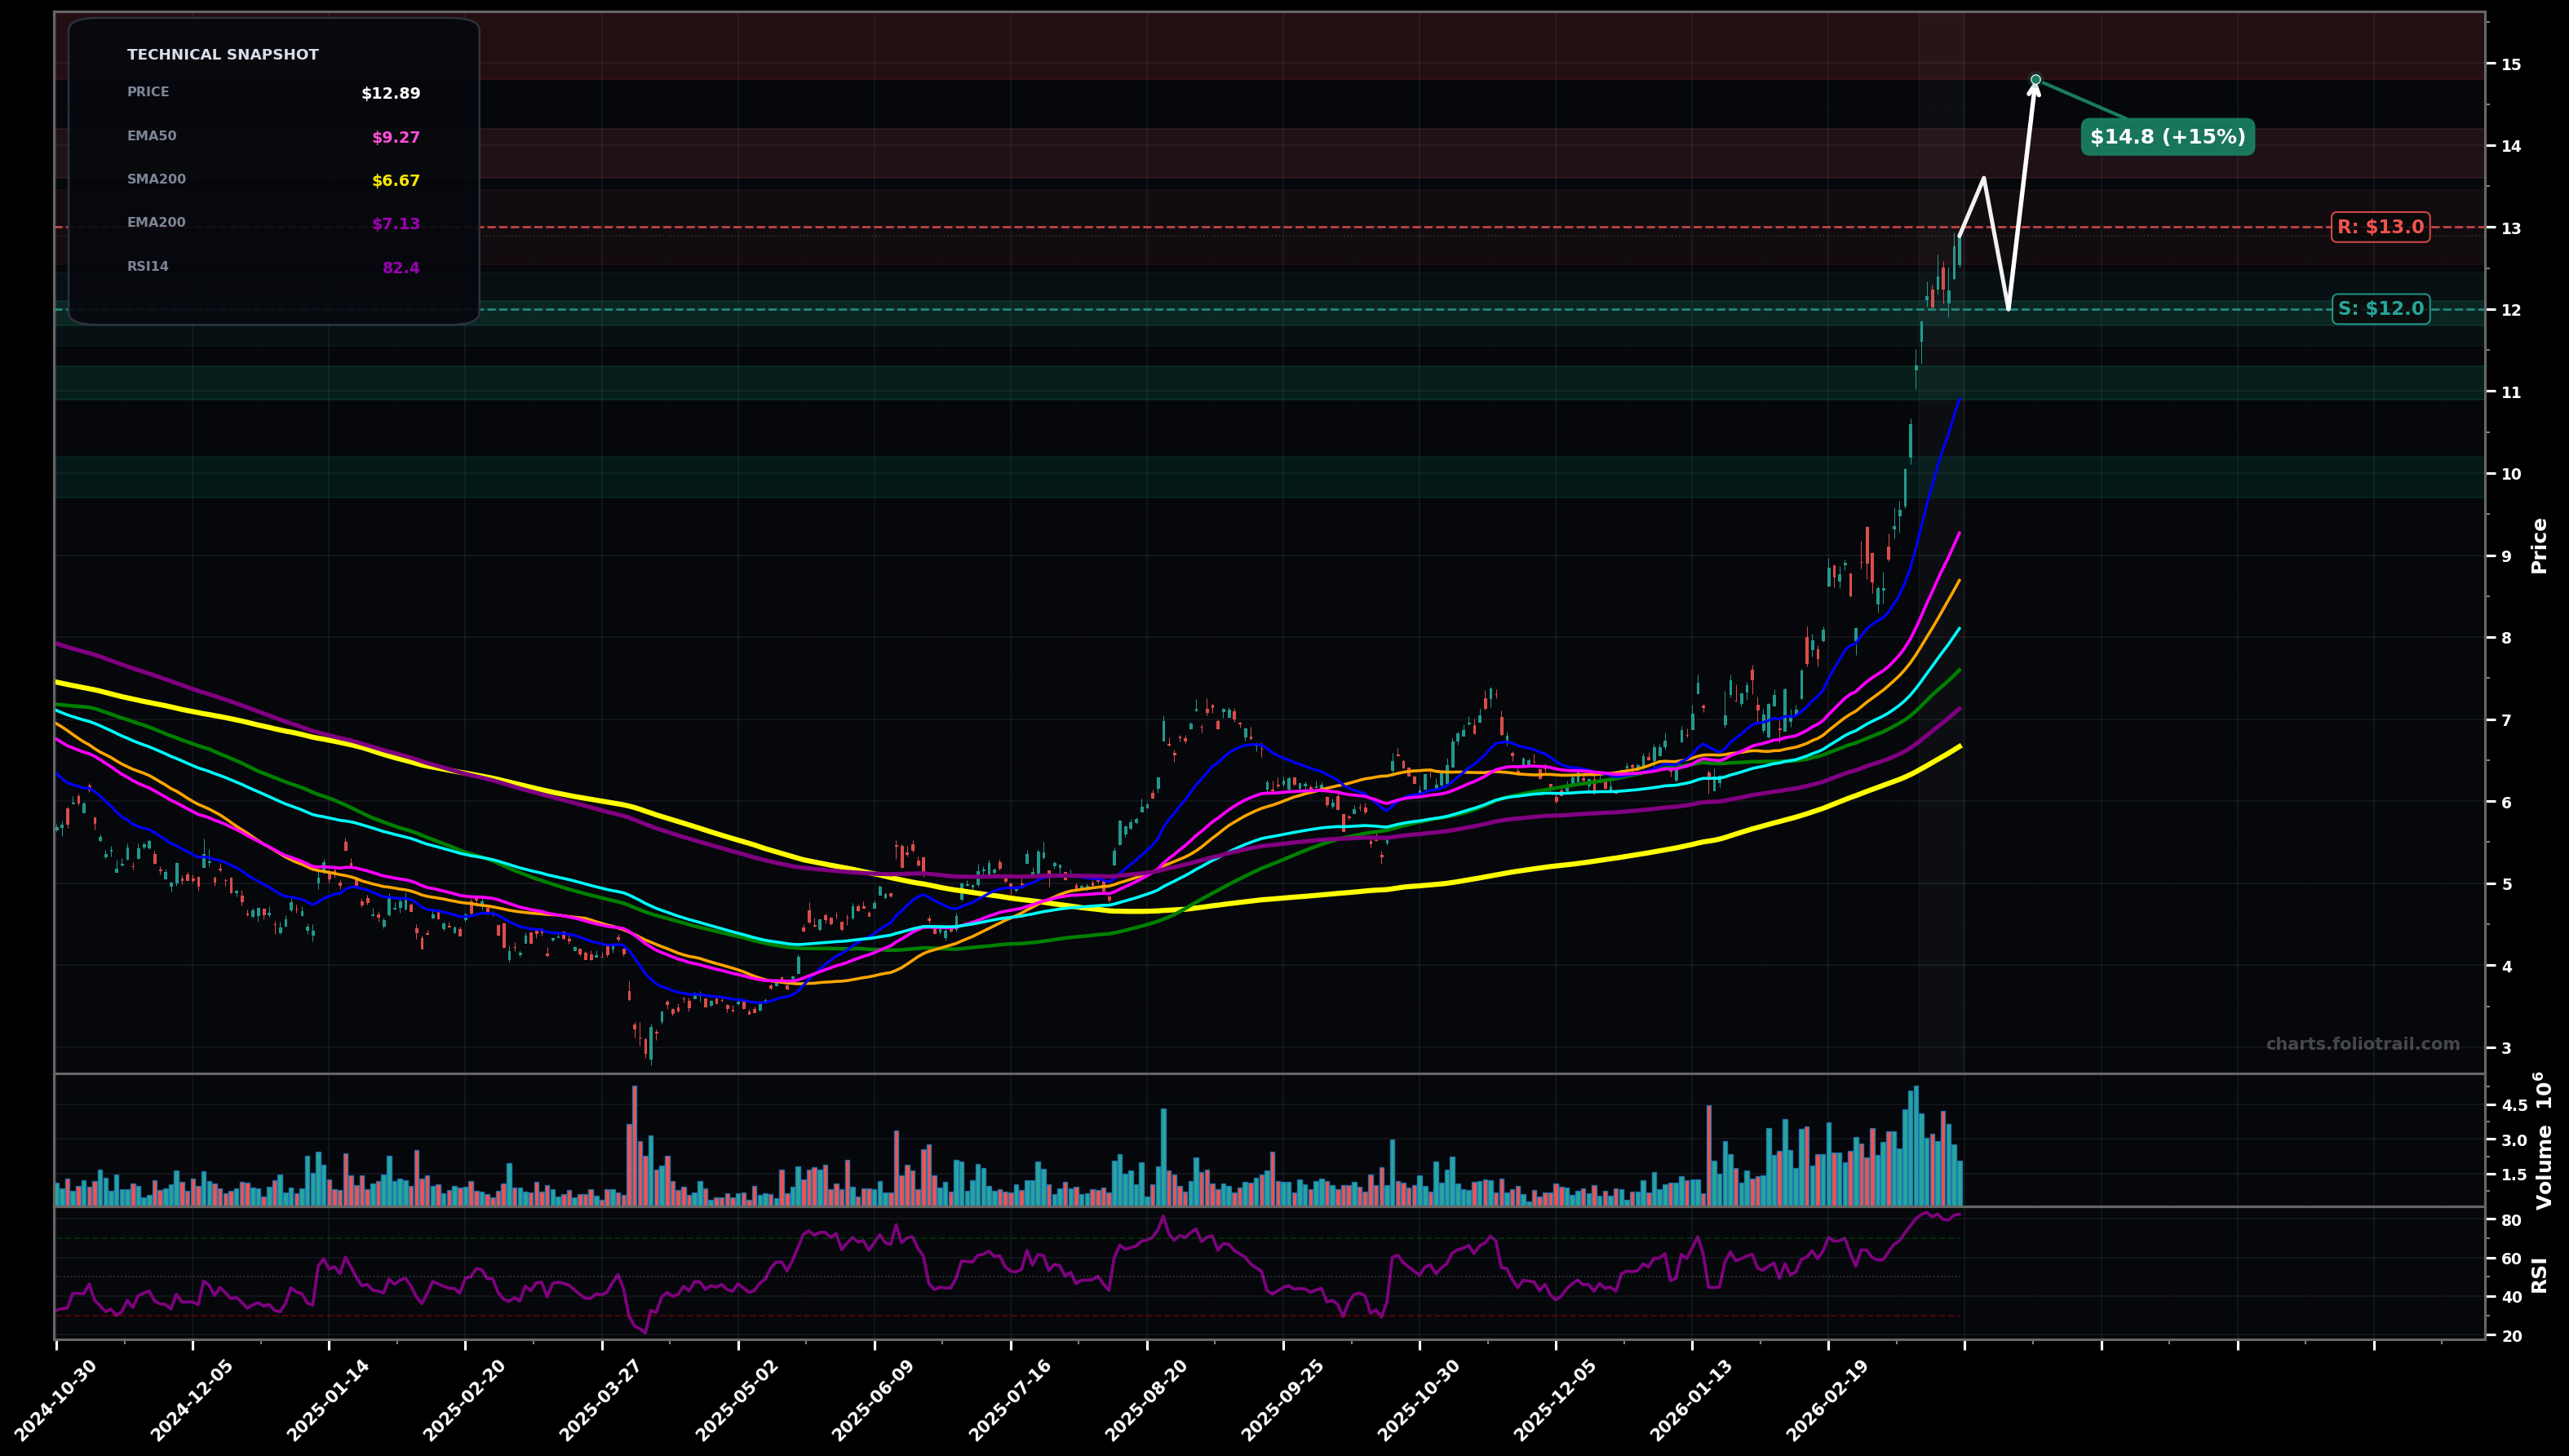
As of March 26, 2026, SSL (Sasol Ltd Sponsored ADR) is in a parabolic state on the daily chart, with a confidence level of 74%. Key support is at $12.0 and key resistance at $13.0. Strong impulsive rally to new highs; price at ~$12.89 with rising volume and RSI ~82 (overbought), extended above short/medium MAs.
Bullish continuation after a brief digestion: shallow pullback/sideways then a push to a new high (parabolic extension, but choppy). Rough probability: 55%.
Mean-reversion pullback: rejection near $13.00 leads to a deeper retrace toward the rising EMA50/EMA100 cluster before trend resumes. Rough probability: 35%.
Daily closes hold above $12.00 (no breakdown back into the prior breakout area).
Daily close below $11.20 (break back under the most recent breakout base/short-term trend support).
Buy-the-dip zones align with prior breakout shelf (~$12), then potential EMA50/100 pullback area (~$11-$10), with heavy add near a deeper fib/structure retrace and prior consolidation (~$10).
Trim into extensions (likely Elliott wave 3/5 behavior) where price is far above EMA50/100 and RSI is extreme; progressively heavier trims at measured-move/fib extension zones above the breakout.
As of March 26, 2026, SSL (Sasol Ltd Sponsored ADR) is in a parabolic state on the daily chart with 74% confidence. Strong impulsive rally to new highs; price at ~$12.89 with rising volume and RSI ~82 (overbought), extended above short/medium MAs.
On the daily timeframe, SSL has key support at $12.0 and key resistance at $13.0. The most likely scenario (bullish) targets $13.6 and $14.8, with a revert level at $12.0.
SSL (Sasol Ltd Sponsored ADR) is currently classified as parabolic on the daily chart, with 74% confidence. Confirmation requires: Daily closes hold above $12.00 (no breakdown back into the prior breakout area). This would be invalidated by: Daily close below $11.20 (break back under the most recent breakout base/short-term trend support).
The most likely scenario (bullish) targets $13.6 and $14.8, with a revert level at $12.0. The alternative scenario (bearish) targets $11.2 and $10.0.
Multi-layer AI agents analyse 200+ stocks across daily, weekly, and monthly timeframes — producing market state classifications, price scenarios with targets, and position entry/exit levels. Updated every trading day after market close. No paywall. No sign-up required.
Built by Foliotrail.
All content on this website — including charts, analysis, price targets, support/resistance levels, and position zones — is generated entirely by AI and provided for educational and informational purposes only.
This is not financial advice. NEXUSNOIR VENTURES SL (the operator of this website) is not a registered investment adviser or broker-dealer. You should not make investment decisions based solely on this information. Always do your own research and consult a qualified financial advisor.
By continuing, you acknowledge that you have read and agree to our full disclaimer & terms of use and privacy policy.