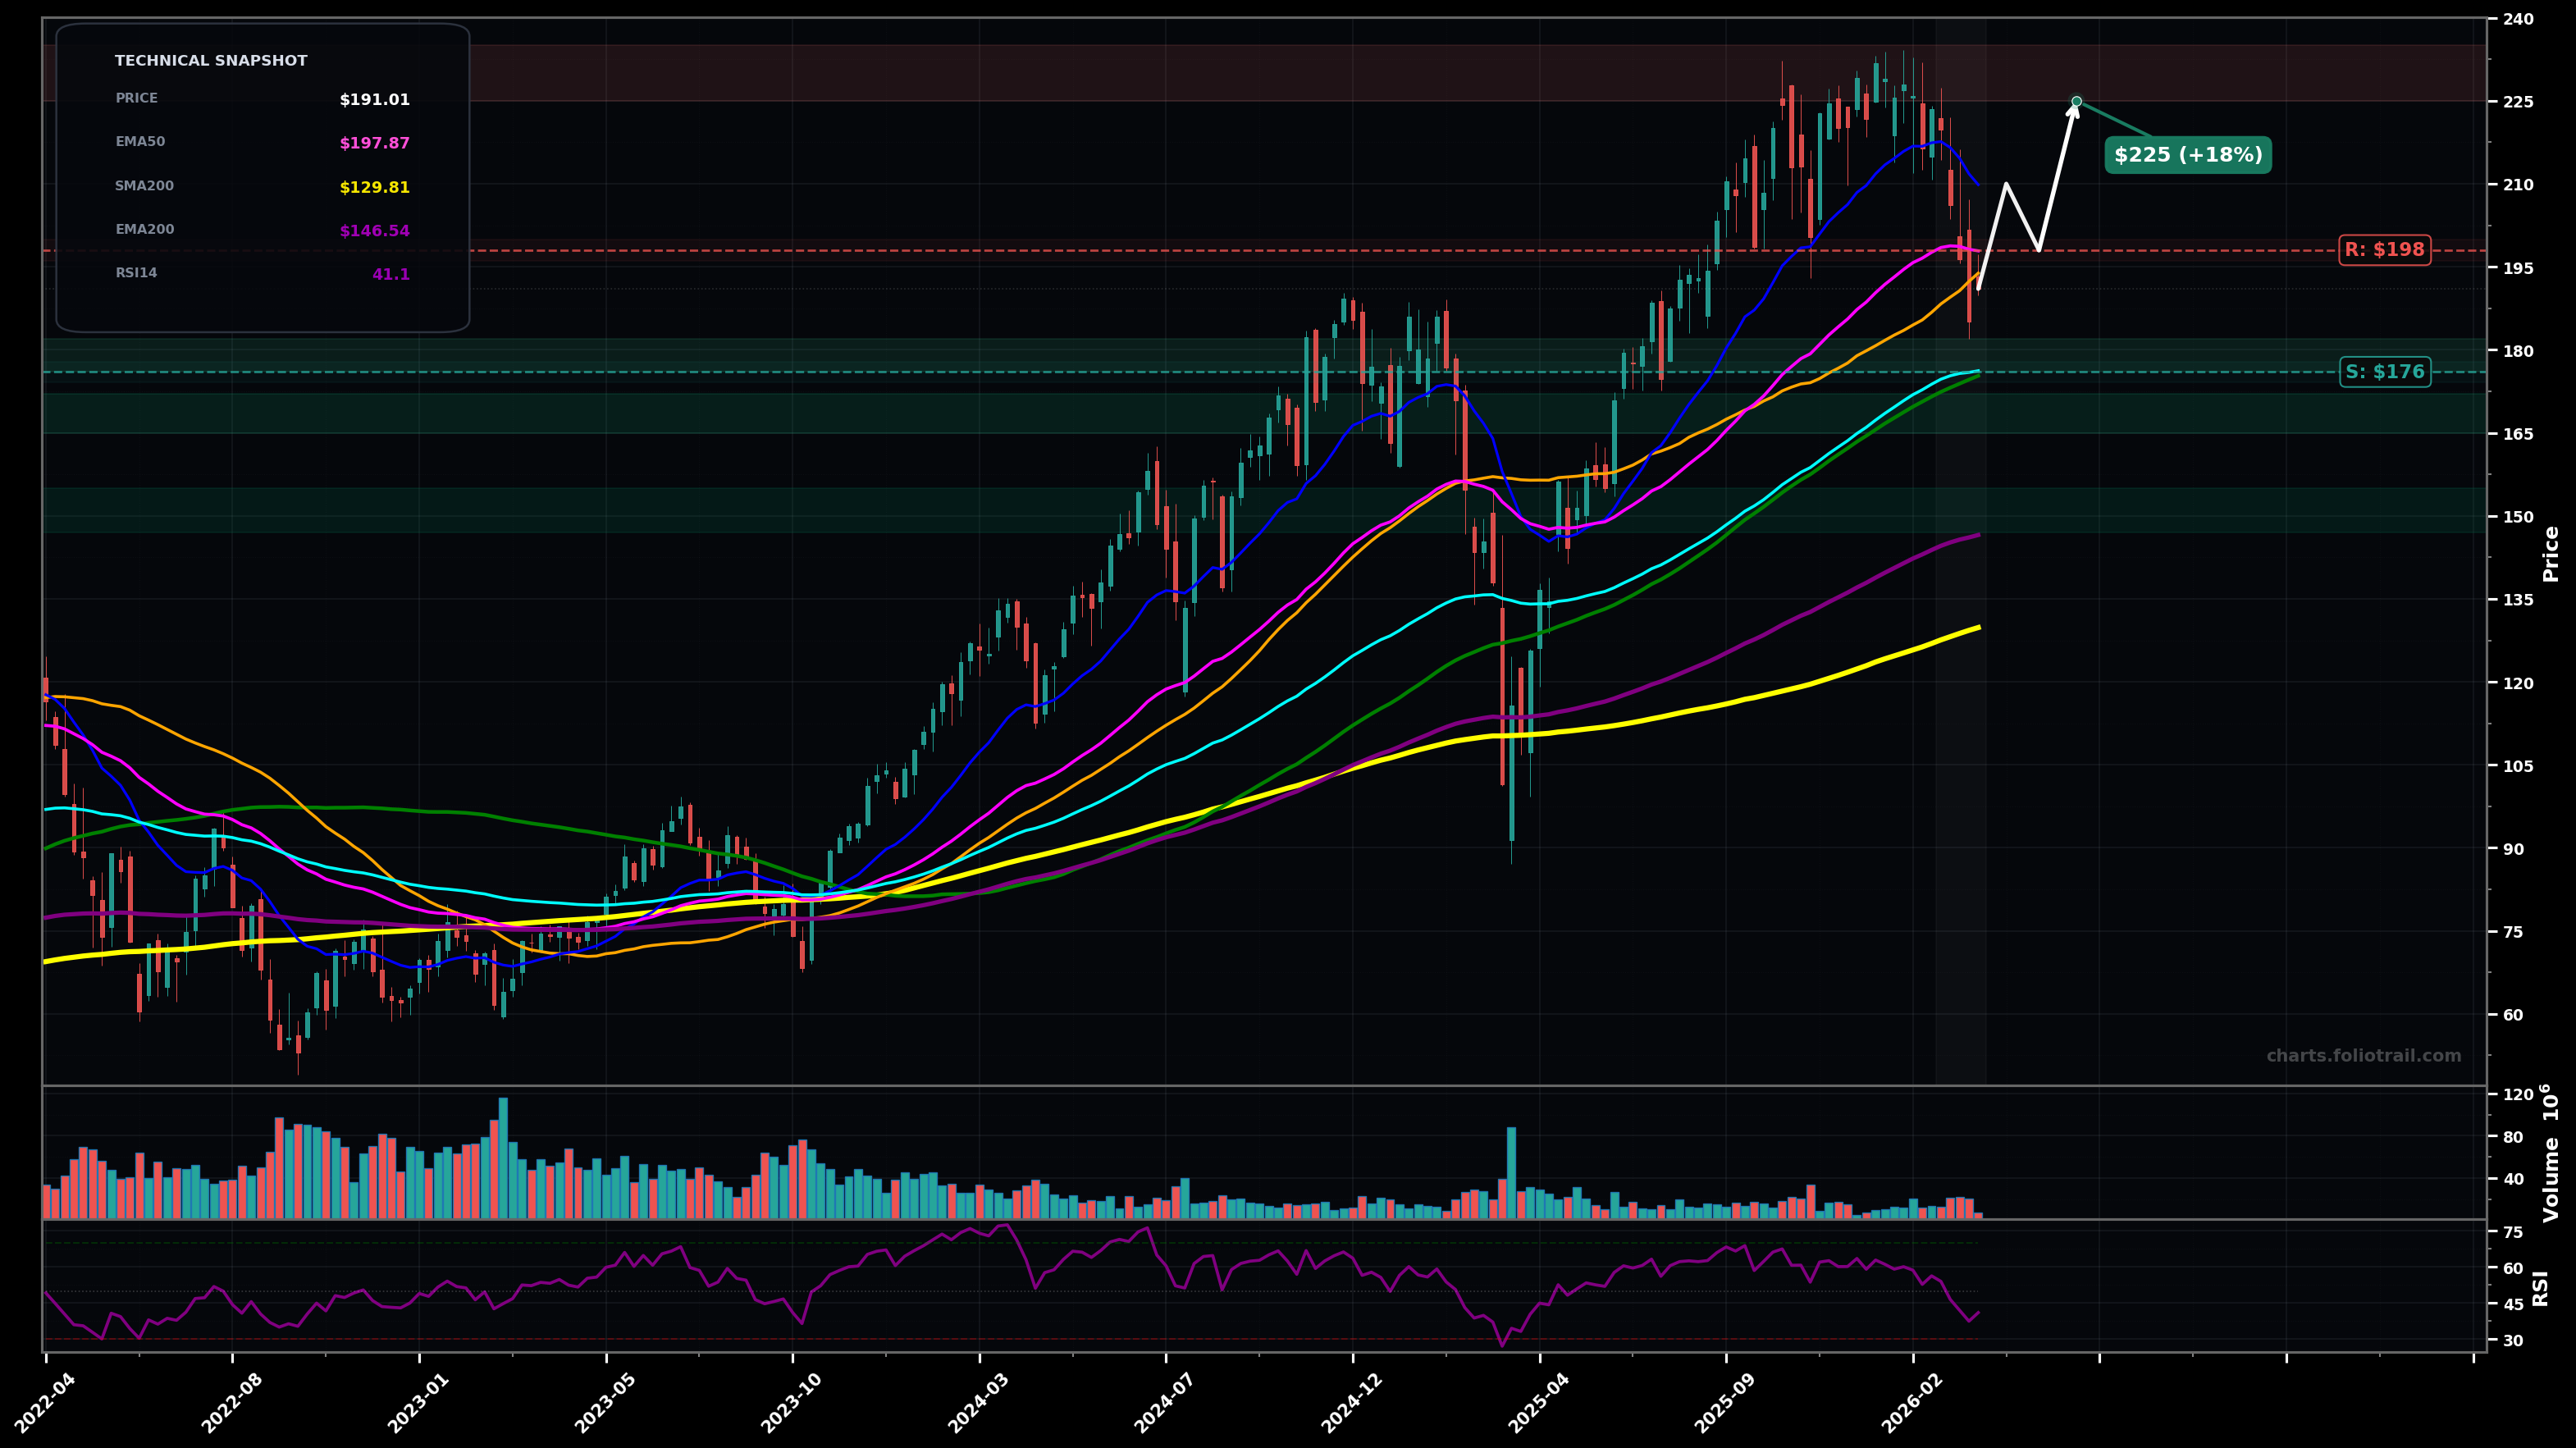
As of March 24, 2026, SPXL (Direxion Daily S&P 500 Bull 3X Shares) is in a bottoming attempt state on the weekly chart, with a confidence level of 58%. Key support is at $176 and key resistance at $198. Weekly pullback from the $225-$230 swing high; price ($191) lost the rising short-term MAs (SMA50/EMA50) and is testing the ~$190 area while still above EMA100/SMA100.
Base-building between ~$176-$198, then a reclaim of EMA50/SMA50 triggers a corrective rally toward the prior breakdown zone; Elliott-wave view: this is likely Wave 4 consolidation after a completed impulsive advance into $225-$230, setting up a Wave 5 attempt later if $176 holds. Fib (approx, using ~$90 swing low to ~$230 swing high): 38.2% sits near ~$176 (key).
Deeper correction continues: failure to reclaim $198 leads to a break of $176 (EMA100/SMA100), opening a move toward the next higher-timeframe supports; Elliott-wave view: Wave 4 morphs into a larger flat/zigzag with an undercut below the 38.2% retrace before stabilizing.
Weekly close back above $198 (reclaim EMA50) and hold with a second close above $198
Weekly close below $176 (loss of EMA100/SMA100 confluence)
Scale-in around Fib 38.2% + EMA100/SMA100 (~$176); add if that breaks into next support band (~$165); heavy add near EMA200 (~$146.5) / deeper retrace where trend buyers often defend.
Trim into prior ATH supply ($225-$235); heavier trimming if price enters an extended blow-off above prior highs ($245+); close/major exit if a multi-year stretch/risk-of-mean-reversion zone develops far above the long MAs (estimated $275-$305).
As of March 24, 2026, SPXL (Direxion Daily S&P 500 Bull 3X Shares) is in a bottoming attempt state on the weekly chart with 58% confidence. Weekly pullback from the $225-$230 swing high; price ($191) lost the rising short-term MAs (SMA50/EMA50) and is testing the ~$190 area while still above EMA100/SMA100.
On the weekly timeframe, SPXL has key support at $176 and key resistance at $198. The most likely scenario (bullish) targets $210 and $225, with a revert level at $198.
SPXL (Direxion Daily S&P 500 Bull 3X Shares) is currently classified as bottoming attempt on the weekly chart, with 58% confidence. Confirmation requires: Weekly close back above $198 (reclaim EMA50) and hold with a second close above $198 This would be invalidated by: Weekly close below $176 (loss of EMA100/SMA100 confluence)
The most likely scenario (bullish) targets $210 and $225, with a revert level at $198. The alternative scenario (bearish) targets $165 and $147.
All content on this website — including charts, analysis, price targets, support/resistance levels, and position zones — is generated entirely by AI and provided for educational and informational purposes only.
This is not financial advice. NEXUSNOIR VENTURES SL (the operator of this website) is not a registered investment adviser or broker-dealer. You should not make investment decisions based solely on this information. Always do your own research and consult a qualified financial advisor.
By continuing, you acknowledge that you have read and agree to our full disclaimer & terms of use and privacy policy.