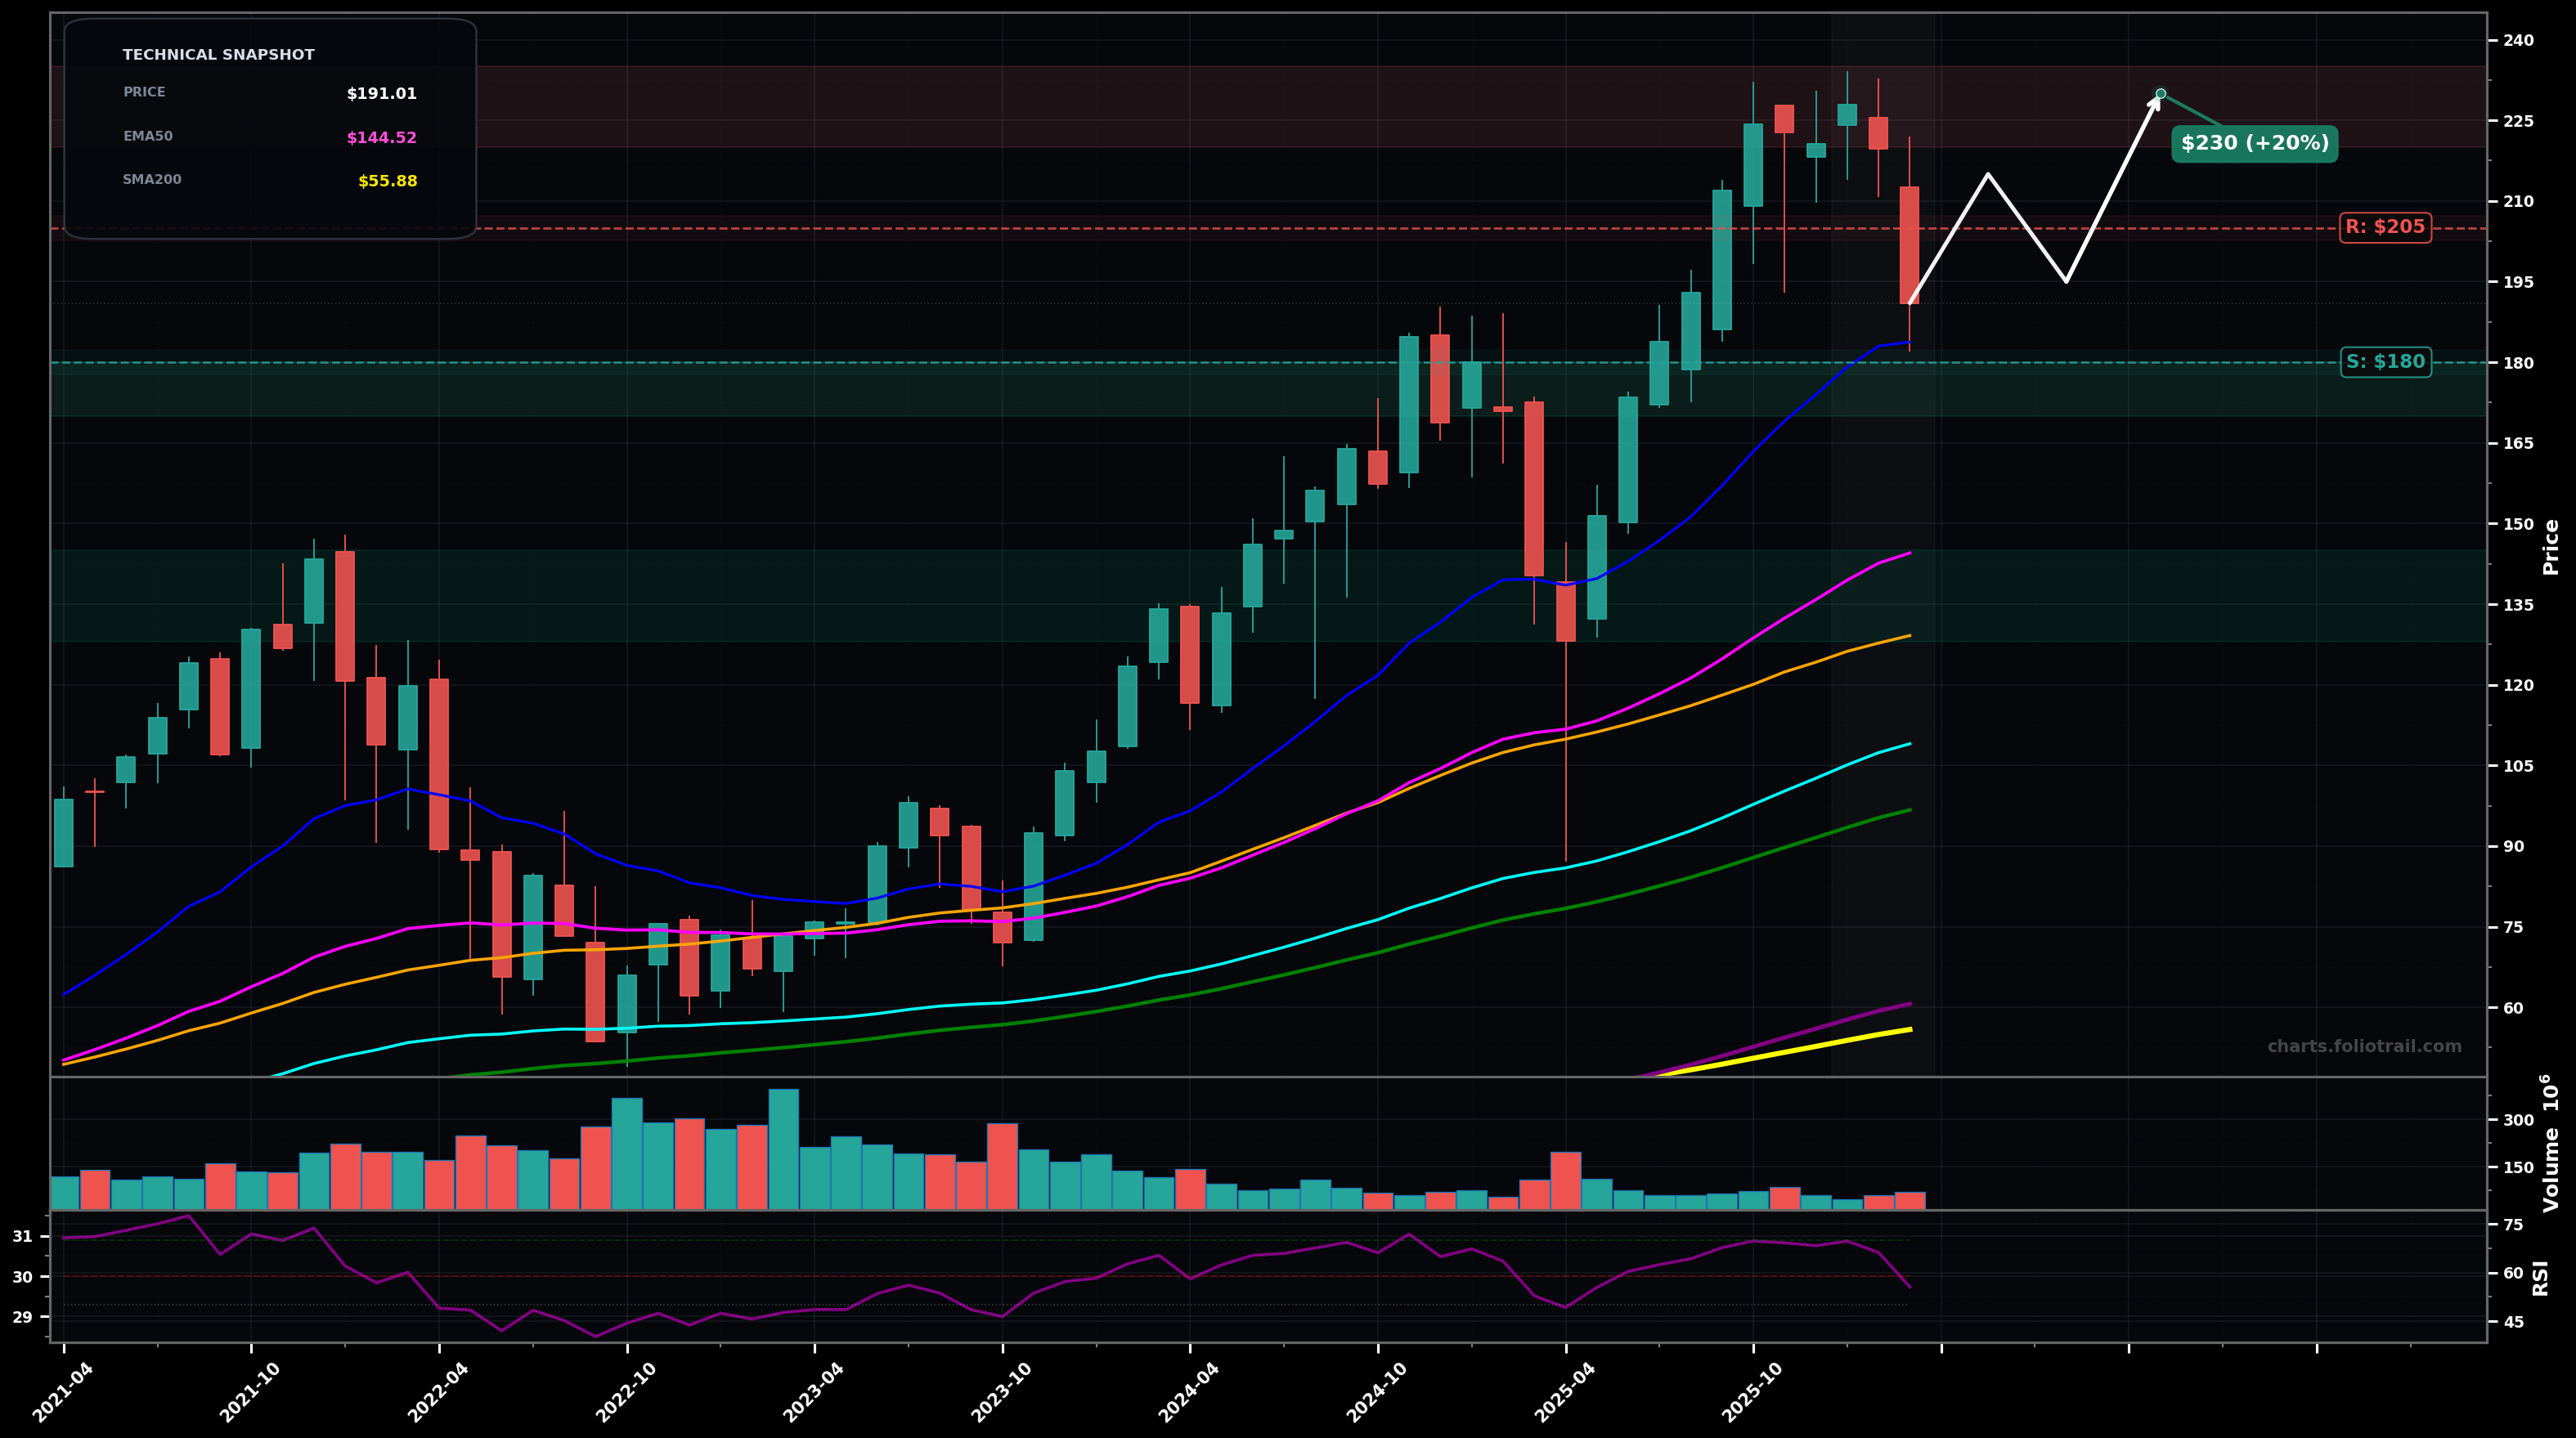
As of March 24, 2026, SPXL (Direxion Daily S&P 500 Bull 3X Shares) is in a uptrend state on the monthly chart, with a confidence level of 68%. Key support is at $180 and key resistance at $205. Monthly uptrend paused after a sharp pullback from the ~$230 area; price ~$191 still well above rising EMA50/EMA100, but momentum cooled (RSI ~56) with a recent large red downswing candle.
Bullish continuation after a higher-low: price holds $180-$175, bases, then reclaims $205 and grinds back toward the prior high; Elliott view: likely Wave 4 (ABC) completing, setting up Wave 5 attempt.
Deeper correction: failure to reclaim $205 and a break below $175 triggers a larger ABC toward the confluence of rising EMA50 and prior consolidation; Fibonacci view: typical 0.382–0.50 retrace of the 2023–2025 impulse sits roughly in the mid-$150s to mid-$130s area.
Monthly close back above $205 would confirm pullback-as-correction and renewed trend continuation
Monthly close below $175 would invalidate the clean uptrend control and raise odds of a deeper ABC/impulse-down leg
Start near prior breakout/swing support ($180) and potential Wave-4 low; add into EMA50 confluence (~$145) and deeper fib retrace zone; heavy add only if a capitulation-style flush tags the mid-$130s while long-term MA stack stays intact.
Trim into prior-high retest and extension; heavier trims if price gets materially stretched above rising EMA50 with RSI expansion; full close reserved for multi-year euphoric extension/overstretch well above trend MAs.
As of March 24, 2026, SPXL (Direxion Daily S&P 500 Bull 3X Shares) is in a uptrend state on the monthly chart with 68% confidence. Monthly uptrend paused after a sharp pullback from the ~$230 area; price ~$191 still well above rising EMA50/EMA100, but momentum cooled (RSI ~56) with a recent large red downswing candle.
On the monthly timeframe, SPXL has key support at $180 and key resistance at $205. The most likely scenario (bullish) targets $215 and $230, with a revert level at $195.
SPXL (Direxion Daily S&P 500 Bull 3X Shares) is currently classified as uptrend on the monthly chart, with 68% confidence. Confirmation requires: Monthly close back above $205 would confirm pullback-as-correction and renewed trend continuation This would be invalidated by: Monthly close below $175 would invalidate the clean uptrend control and raise odds of a deeper ABC/impulse-down leg
The most likely scenario (bullish) targets $215 and $230, with a revert level at $195. The alternative scenario (bearish) targets $160 and $145.
All content on this website — including charts, analysis, price targets, support/resistance levels, and position zones — is generated entirely by AI and provided for educational and informational purposes only.
This is not financial advice. NEXUSNOIR VENTURES SL (the operator of this website) is not a registered investment adviser or broker-dealer. You should not make investment decisions based solely on this information. Always do your own research and consult a qualified financial advisor.
By continuing, you acknowledge that you have read and agree to our full disclaimer & terms of use and privacy policy.