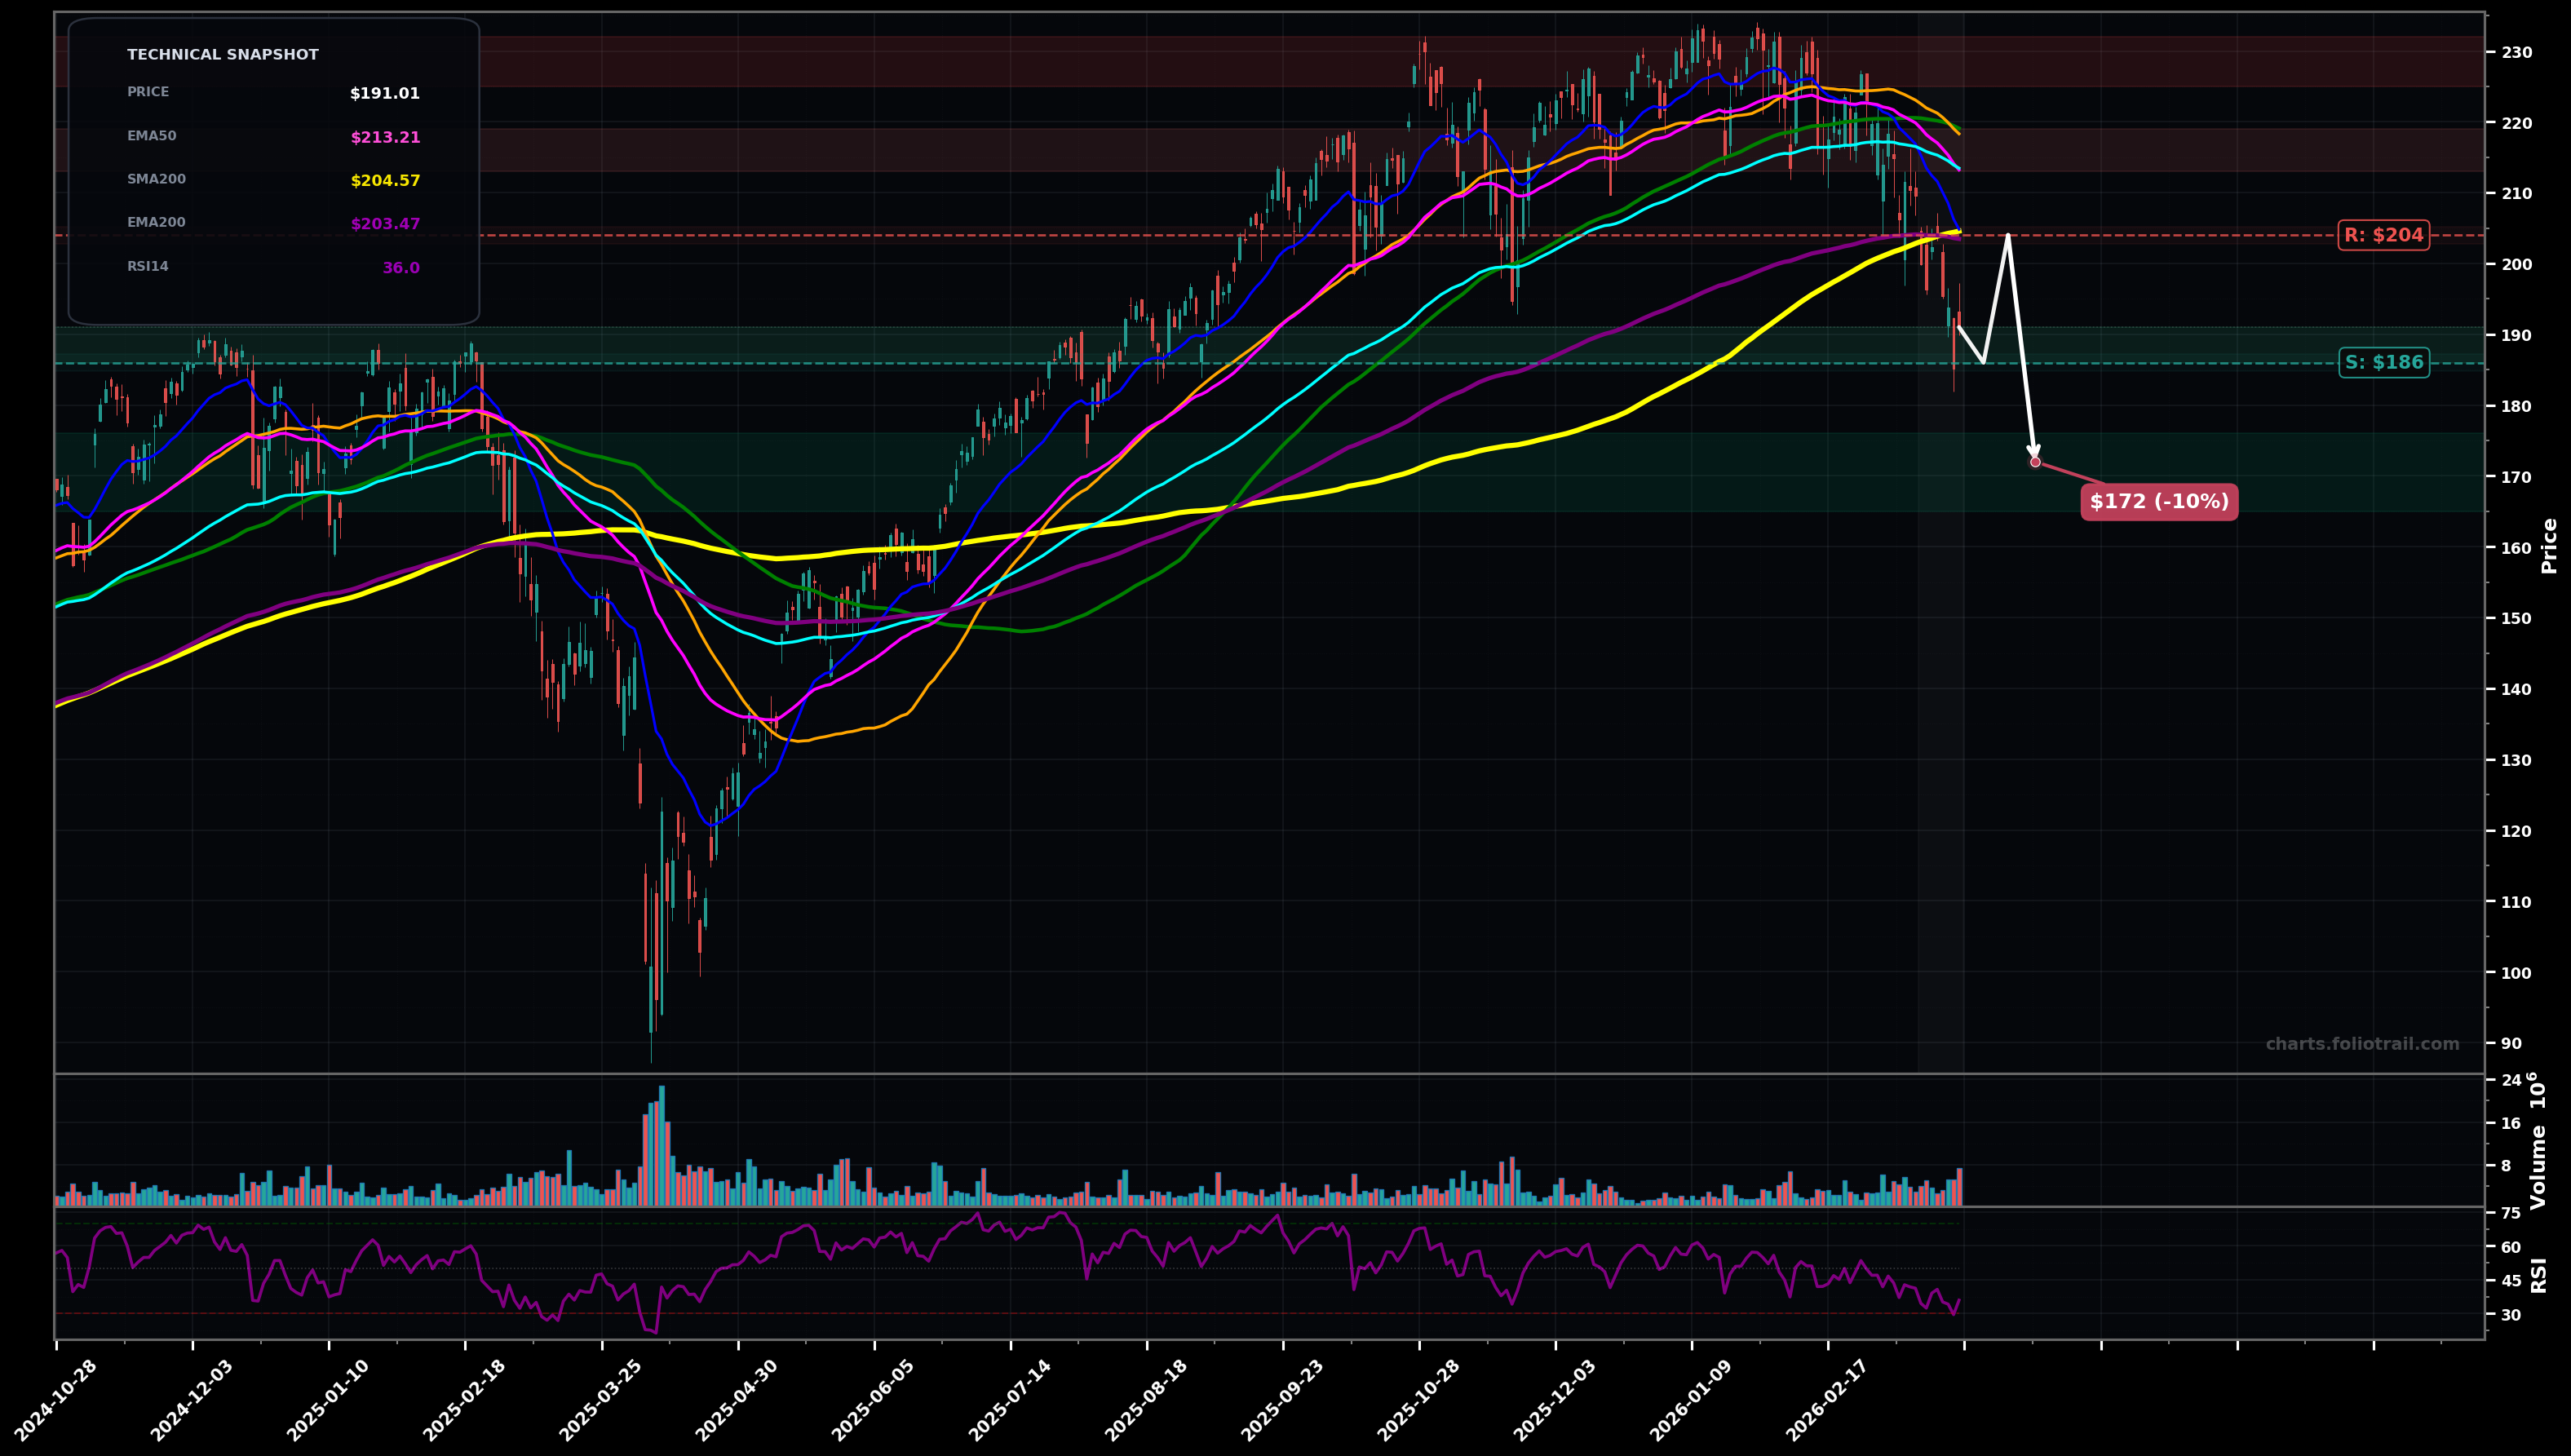
As of March 24, 2026, SPXL (Direxion Daily S&P 500 Bull 3X Shares) is in a falling knife state on the daily chart, with a confidence level of 72%. Key support is at $186 and key resistance at $204. Sharp selloff with consecutive red candles; price lost the rising MA cluster and is now trading below EMA200/SMA200 with RSI deeply weak (~36).
Bearish continuation: any bounce stalls into the broken MA shelf ($200-$205), then a push to fresh LL with sellers targeting the next Fibonacci demand zone (0.618-0.786 of the prior upswing) and prior pivot support.
Relief-rally / bottoming attempt: price holds the $186 area, forms a higher low, then reclaims EMA200/SMA200 and mean-reverts toward the underside of EMA50/EMA100 cluster.
Daily close below $186 would confirm continued falling-knife continuation toward the next demand zone.
Two consecutive daily closes back above $204 would invalidate the falling-knife posture (reclaim of EMA200/SMA200 zone).
Scale at support ($186) then add into deeper Fib retrace/previous pivot demand; heavy add only if capitulation into the next major support band while RSI remains depressed.
Trim into mean-reversion toward EMA50/EMA100 and prior range highs; close if price gets back to the prior topping zone where wave-5/exhaustion risk rises.
As of March 24, 2026, SPXL (Direxion Daily S&P 500 Bull 3X Shares) is in a falling knife state on the daily chart with 72% confidence. Sharp selloff with consecutive red candles; price lost the rising MA cluster and is now trading below EMA200/SMA200 with RSI deeply weak (~36).
On the daily timeframe, SPXL has key support at $186 and key resistance at $204. The most likely scenario (bearish) targets $186 and $172, with a revert level at $204.
SPXL (Direxion Daily S&P 500 Bull 3X Shares) is currently classified as falling knife on the daily chart, with 72% confidence. Confirmation requires: Daily close below $186 would confirm continued falling-knife continuation toward the next demand zone. This would be invalidated by: Two consecutive daily closes back above $204 would invalidate the falling-knife posture (reclaim of EMA200/SMA200 zone).
The most likely scenario (bearish) targets $186 and $172, with a revert level at $204. The alternative scenario (bullish) targets $204 and $213.
All content on this website — including charts, analysis, price targets, support/resistance levels, and position zones — is generated entirely by AI and provided for educational and informational purposes only.
This is not financial advice. NEXUSNOIR VENTURES SL (the operator of this website) is not a registered investment adviser or broker-dealer. You should not make investment decisions based solely on this information. Always do your own research and consult a qualified financial advisor.
By continuing, you acknowledge that you have read and agree to our full disclaimer & terms of use and privacy policy.