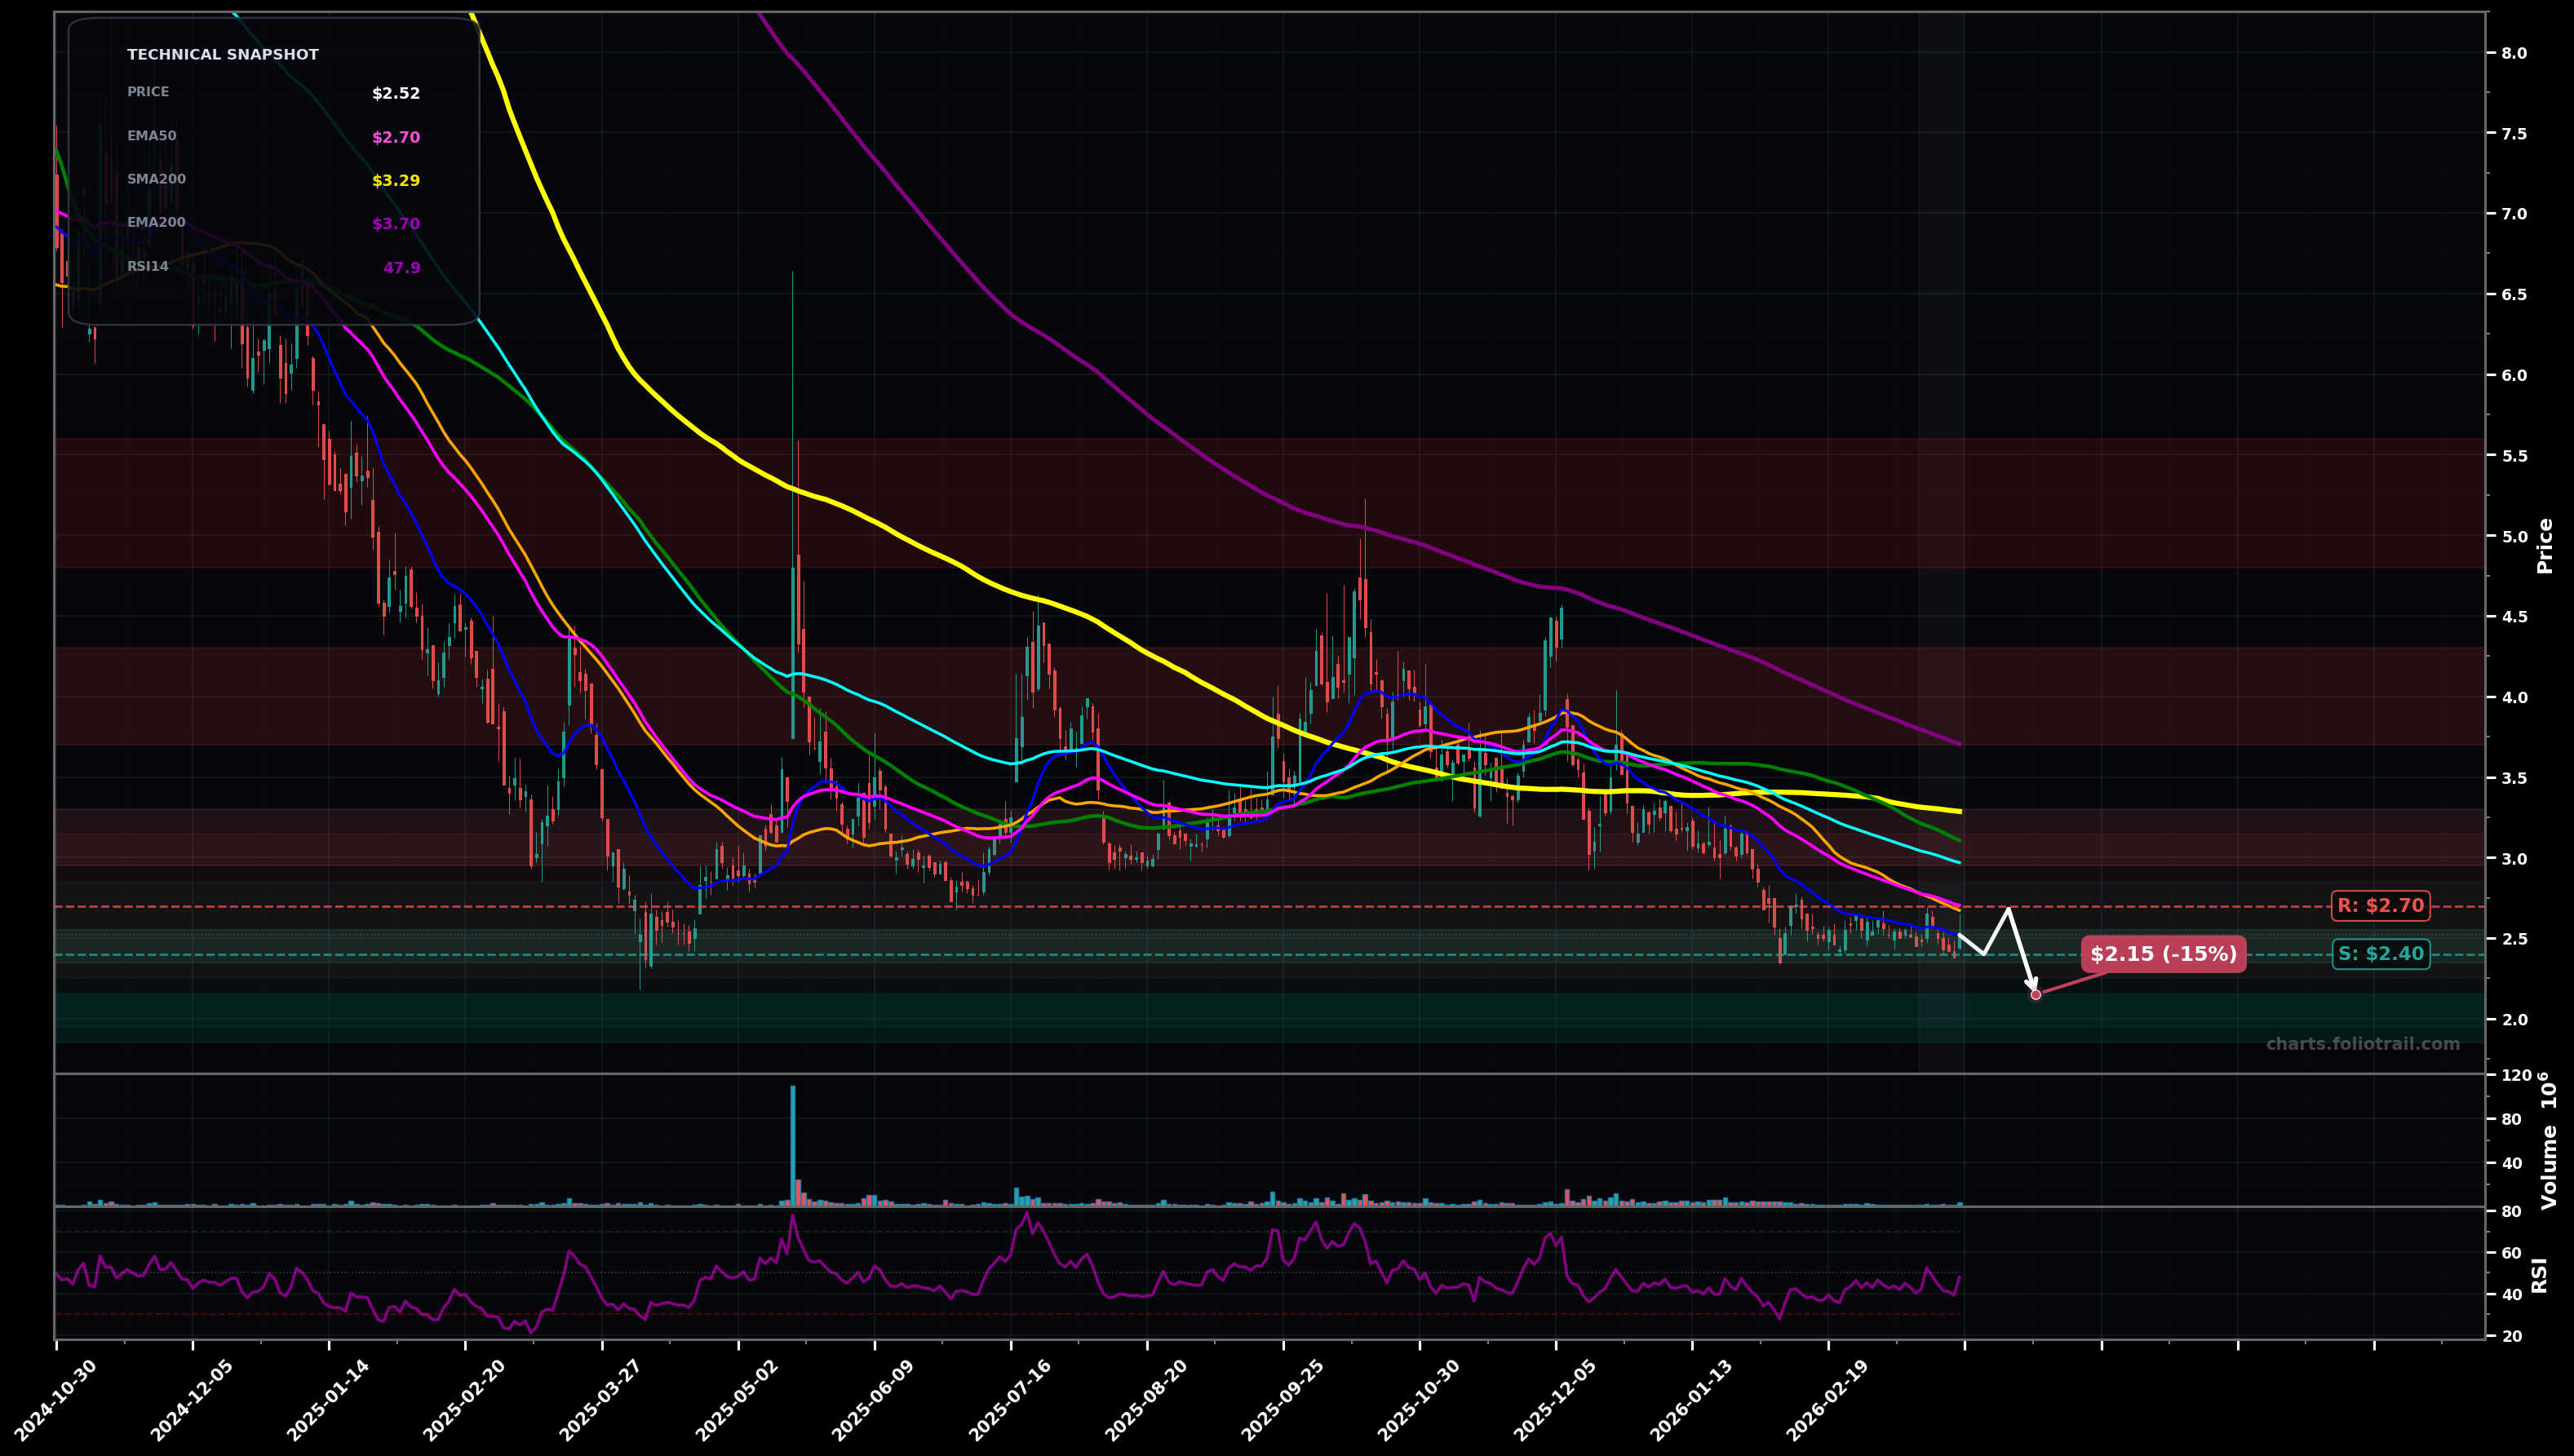
As of March 26, 2026, SPCE (Virgin Galactic Holdings Inc.) is in a downtrend state on the daily chart, with a confidence level of 73%. Key support is at $2.40 and key resistance at $2.70. Price (~$2.52) is grinding lower into a prior pivot area while staying below the main fast/medium MAs; RSI ~48 suggests weak bounce attempts but no trend reversal yet.
Bearish continuation: a weak bounce into the $2.65-$2.75 area gets rejected by EMA50/SMA50, followed by a breakdown to retest the recent base lows; Elliott view: still in a larger corrective/impulsive down leg (wave 5 or C) with only small degree bounces; Fib-wise, price is still trading below the typical 0.382-0.618 retrace band of the last downswing.
Bullish mean-reversion: price holds $2.40-$2.50, forms a higher low, then pushes through the MA cluster for a larger retrace; Elliott view: a corrective wave (2/B) extends higher; Fib targets align with retracing toward the next congestion/MAs.
Daily close below $2.40 would confirm continuation (fresh LL below the current swing-low reference zone).
Two consecutive daily closes above $2.70 would invalidate the immediate downtrend pressure (reclaim of EMA50 area).
Staggered entries around the current swing-low support (~$2.40-$2.50), then deeper adds at the next likely capitulation/liquidity pocket if the downtrend prints another LL.
Trim into the first meaningful MA/structure reclaim zone (~$3.0-$3.3), then heavier trims into prior breakdown supply ($3.7-$4.3); fully exit if price revisits the higher-degree supply zone ($4.8+), which would be unusually stretched versus the current MA stack.
As of March 26, 2026, SPCE (Virgin Galactic Holdings Inc.) is in a downtrend state on the daily chart with 73% confidence. Price (~$2.52) is grinding lower into a prior pivot area while staying below the main fast/medium MAs; RSI ~48 suggests weak bounce attempts but no trend reversal yet.
On the daily timeframe, SPCE has key support at $2.40 and key resistance at $2.70. The most likely scenario (bearish) targets $2.40 and $2.15, with a revert level at $2.68.
SPCE (Virgin Galactic Holdings Inc.) is currently classified as downtrend on the daily chart, with 73% confidence. Confirmation requires: Daily close below $2.40 would confirm continuation (fresh LL below the current swing-low reference zone). This would be invalidated by: Two consecutive daily closes above $2.70 would invalidate the immediate downtrend pressure (reclaim of EMA50 area).
The most likely scenario (bearish) targets $2.40 and $2.15, with a revert level at $2.68. The alternative scenario (bullish) targets $2.97 and $3.30.
Multi-layer AI agents analyse 200+ stocks across daily, weekly, and monthly timeframes — producing market state classifications, price scenarios with targets, and position entry/exit levels. Updated every trading day after market close. No paywall. No sign-up required.
Built by Foliotrail.
All content on this website — including charts, analysis, price targets, support/resistance levels, and position zones — is generated entirely by AI and provided for educational and informational purposes only.
This is not financial advice. NEXUSNOIR VENTURES SL (the operator of this website) is not a registered investment adviser or broker-dealer. You should not make investment decisions based solely on this information. Always do your own research and consult a qualified financial advisor.
By continuing, you acknowledge that you have read and agree to our full disclaimer & terms of use and privacy policy.