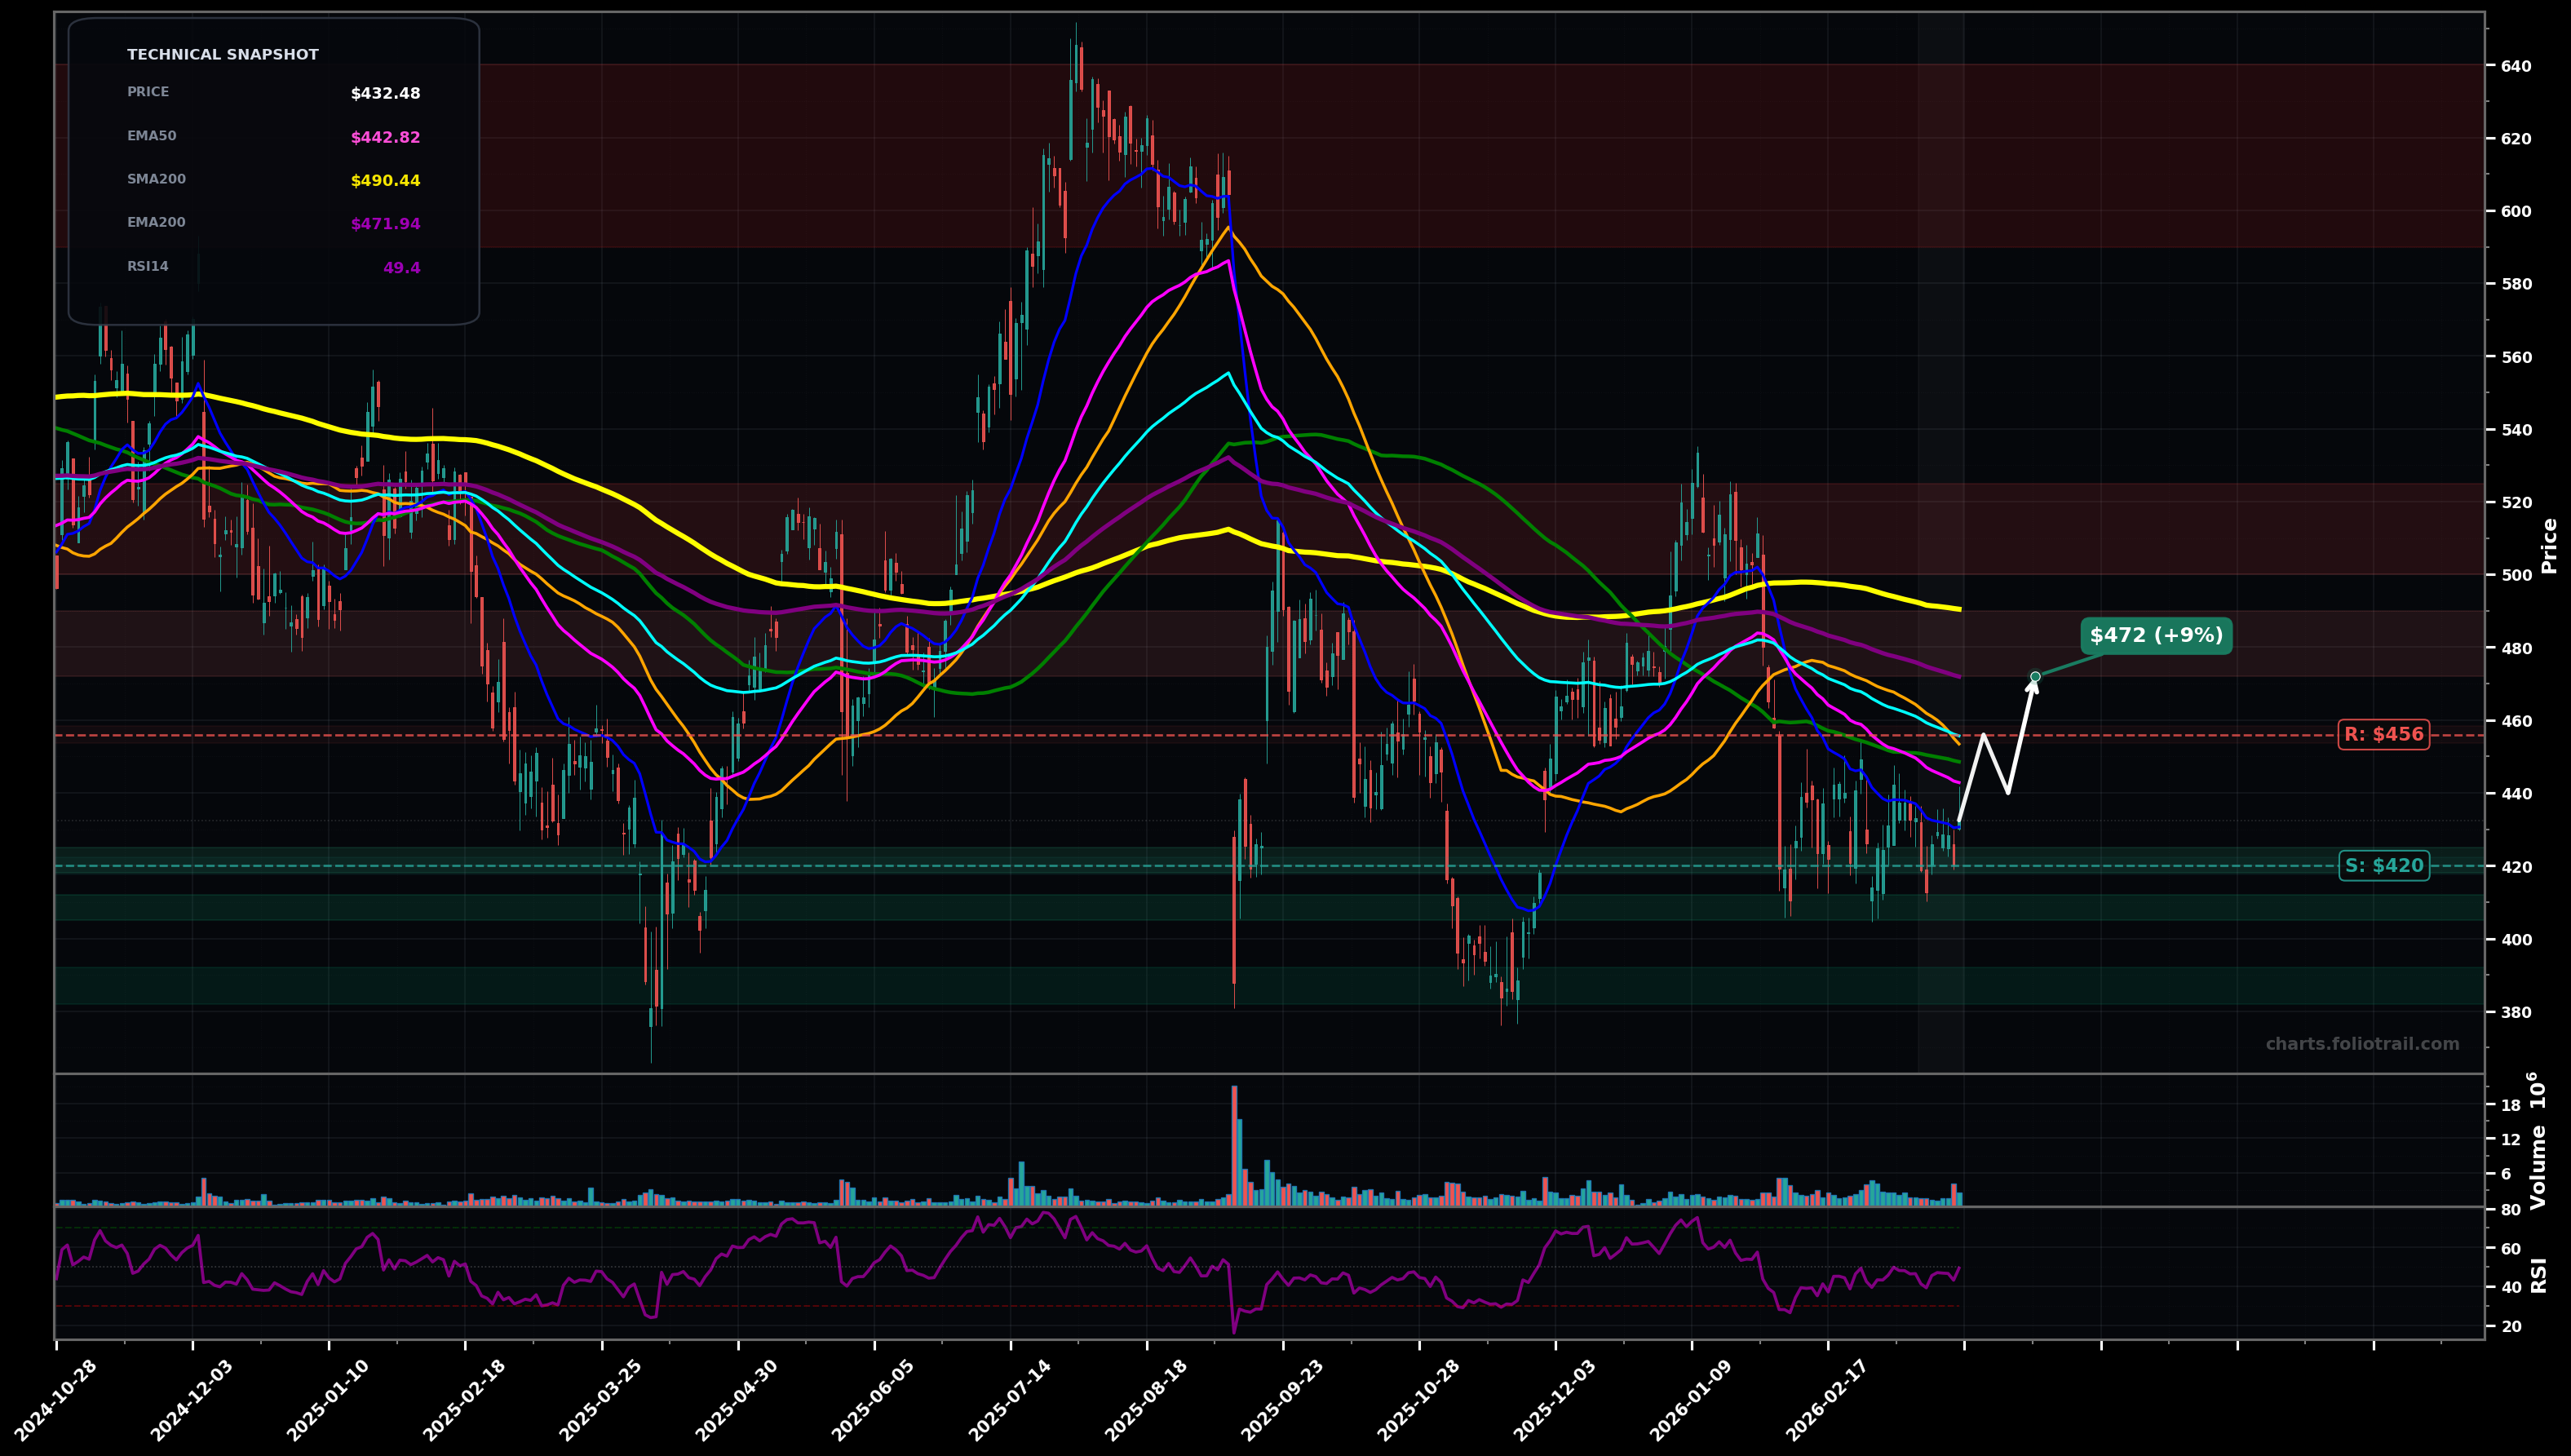
As of March 24, 2026, SNPS (Synopsys, Inc.) is in a downtrend state on the daily chart, with a confidence level of 66%. Key support is at $420 and key resistance at $456. Price at ~$432 is below most major MAs after a sharp selloff from the ~$500 area; recent candles are tight and slightly upward but still under overhead MA resistance.
Base-building then mean-reversion bounce into the $443–$456 moving-average cluster; likely rejection initially, with a possible later push to the ~$470 area if reclaimed.
Failure to hold the current range and breakdown through the recent swing-low zone, extending the correction toward the next demand area near the prior lows.
Daily close below $420 followed by a break under $410 (new LL) would confirm downtrend continuation.
Two consecutive daily closes above $456 would invalidate the immediate downtrend bias (reclaim EMA100/cluster).
Layer bids at prior demand/swing-low zones; add more if breakdown flushes into deeper support while keeping risk defined under the next support shelf.
Trim into major overhead supply and long-term MAs (SMA200/EMA200 region then prior distribution); fully exit if price returns to prior peak/exhaustion zone.
As of March 24, 2026, SNPS (Synopsys, Inc.) is in a downtrend state on the daily chart with 66% confidence. Price at ~$432 is below most major MAs after a sharp selloff from the ~$500 area; recent candles are tight and slightly upward but still under overhead MA resistance.
On the daily timeframe, SNPS has key support at $420 and key resistance at $456. The most likely scenario (bullish) targets $456 and $472, with a revert level at $440.
SNPS (Synopsys, Inc.) is currently classified as downtrend on the daily chart, with 66% confidence. Confirmation requires: Daily close below $420 followed by a break under $410 (new LL) would confirm downtrend continuation. This would be invalidated by: Two consecutive daily closes above $456 would invalidate the immediate downtrend bias (reclaim EMA100/cluster).
The most likely scenario (bullish) targets $456 and $472, with a revert level at $440. The alternative scenario (bearish) targets $410 and $385.
All content on this website — including charts, analysis, price targets, support/resistance levels, and position zones — is generated entirely by AI and provided for educational and informational purposes only.
This is not financial advice. NEXUSNOIR VENTURES SL (the operator of this website) is not a registered investment adviser or broker-dealer. You should not make investment decisions based solely on this information. Always do your own research and consult a qualified financial advisor.
By continuing, you acknowledge that you have read and agree to our full disclaimer & terms of use and privacy policy.