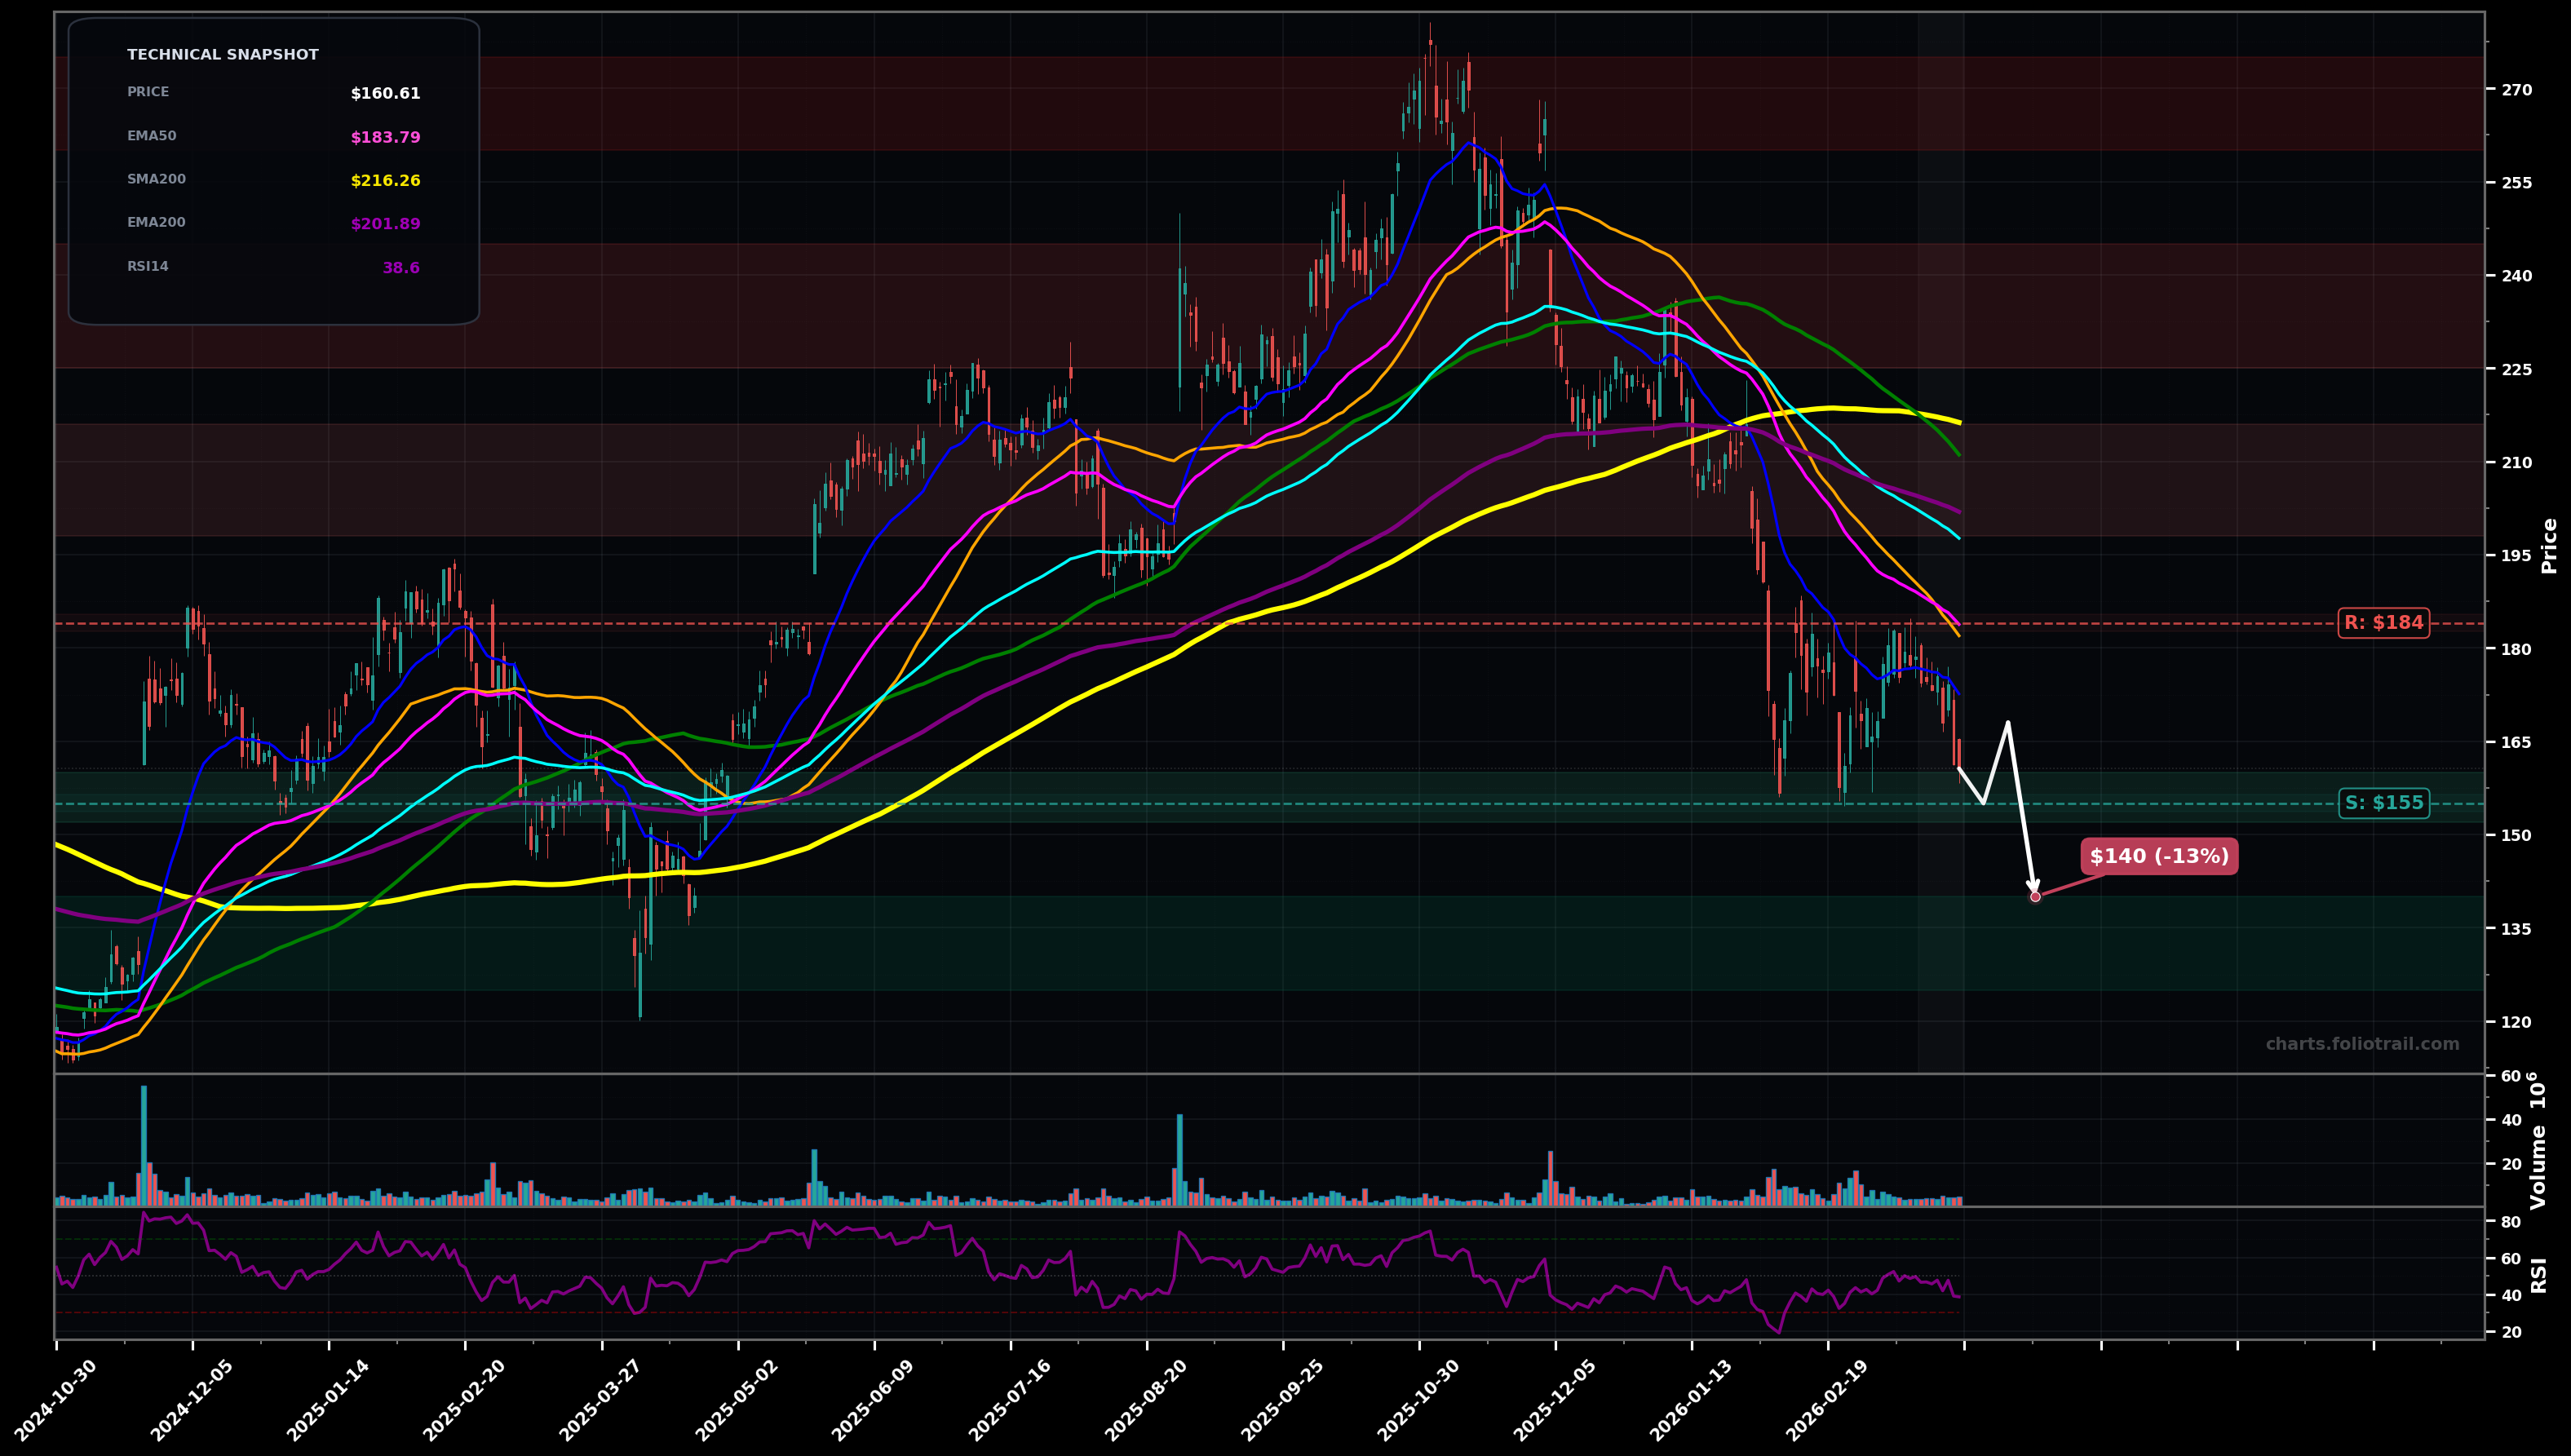
As of March 26, 2026, SNOW (Snowflake Inc.) is in a downtrend state on the daily chart, with a confidence level of 78%. Key support is at $155 and key resistance at $184. Sharp selloff from the $270s followed by a weak bounce; price ($160.61) is back below key moving averages with RSI ~38 (bearish momentum).
Bear continuation: breakdown/flush below the recent swing-low zone, then attempts to base lower.
Bullish mean-reversion: holds $155 and grinds higher into the MA band; possible breakout-retest attempt if reclaim sticks.
Daily close below $155 would confirm trend continuation to new local lows
Two daily closes back above $184 (EMA50) would invalidate the immediate downtrend pressure
Start near prior pivot support (~$155) with RSI depressed; add on breakdown-to-support conversion near $140; heavy add only on capitulation toward prior base/round-number demand ($125-$140).
Trim into the falling long-MA/overhead supply area (EMA100/EMA200/SMA100-200 region ~$198-$216 and above); heavier trims into prior distribution ($225-$245); full exit near prior cycle peak supply ($260-$275).
As of March 26, 2026, SNOW (Snowflake Inc.) is in a downtrend state on the daily chart with 78% confidence. Sharp selloff from the $270s followed by a weak bounce; price ($160.61) is back below key moving averages with RSI ~38 (bearish momentum).
On the daily timeframe, SNOW has key support at $155 and key resistance at $184. The most likely scenario (bearish) targets $155 and $140, with a revert level at $168.
SNOW (Snowflake Inc.) is currently classified as downtrend on the daily chart, with 78% confidence. Confirmation requires: Daily close below $155 would confirm trend continuation to new local lows This would be invalidated by: Two daily closes back above $184 (EMA50) would invalidate the immediate downtrend pressure
The most likely scenario (bearish) targets $155 and $140, with a revert level at $168. The alternative scenario (bullish) targets $184 and $198.
Multi-layer AI agents analyse 200+ stocks across daily, weekly, and monthly timeframes — producing market state classifications, price scenarios with targets, and position entry/exit levels. Updated every trading day after market close. No paywall. No sign-up required.
Built by Foliotrail.
All content on this website — including charts, analysis, price targets, support/resistance levels, and position zones — is generated entirely by AI and provided for educational and informational purposes only.
This is not financial advice. NEXUSNOIR VENTURES SL (the operator of this website) is not a registered investment adviser or broker-dealer. You should not make investment decisions based solely on this information. Always do your own research and consult a qualified financial advisor.
By continuing, you acknowledge that you have read and agree to our full disclaimer & terms of use and privacy policy.