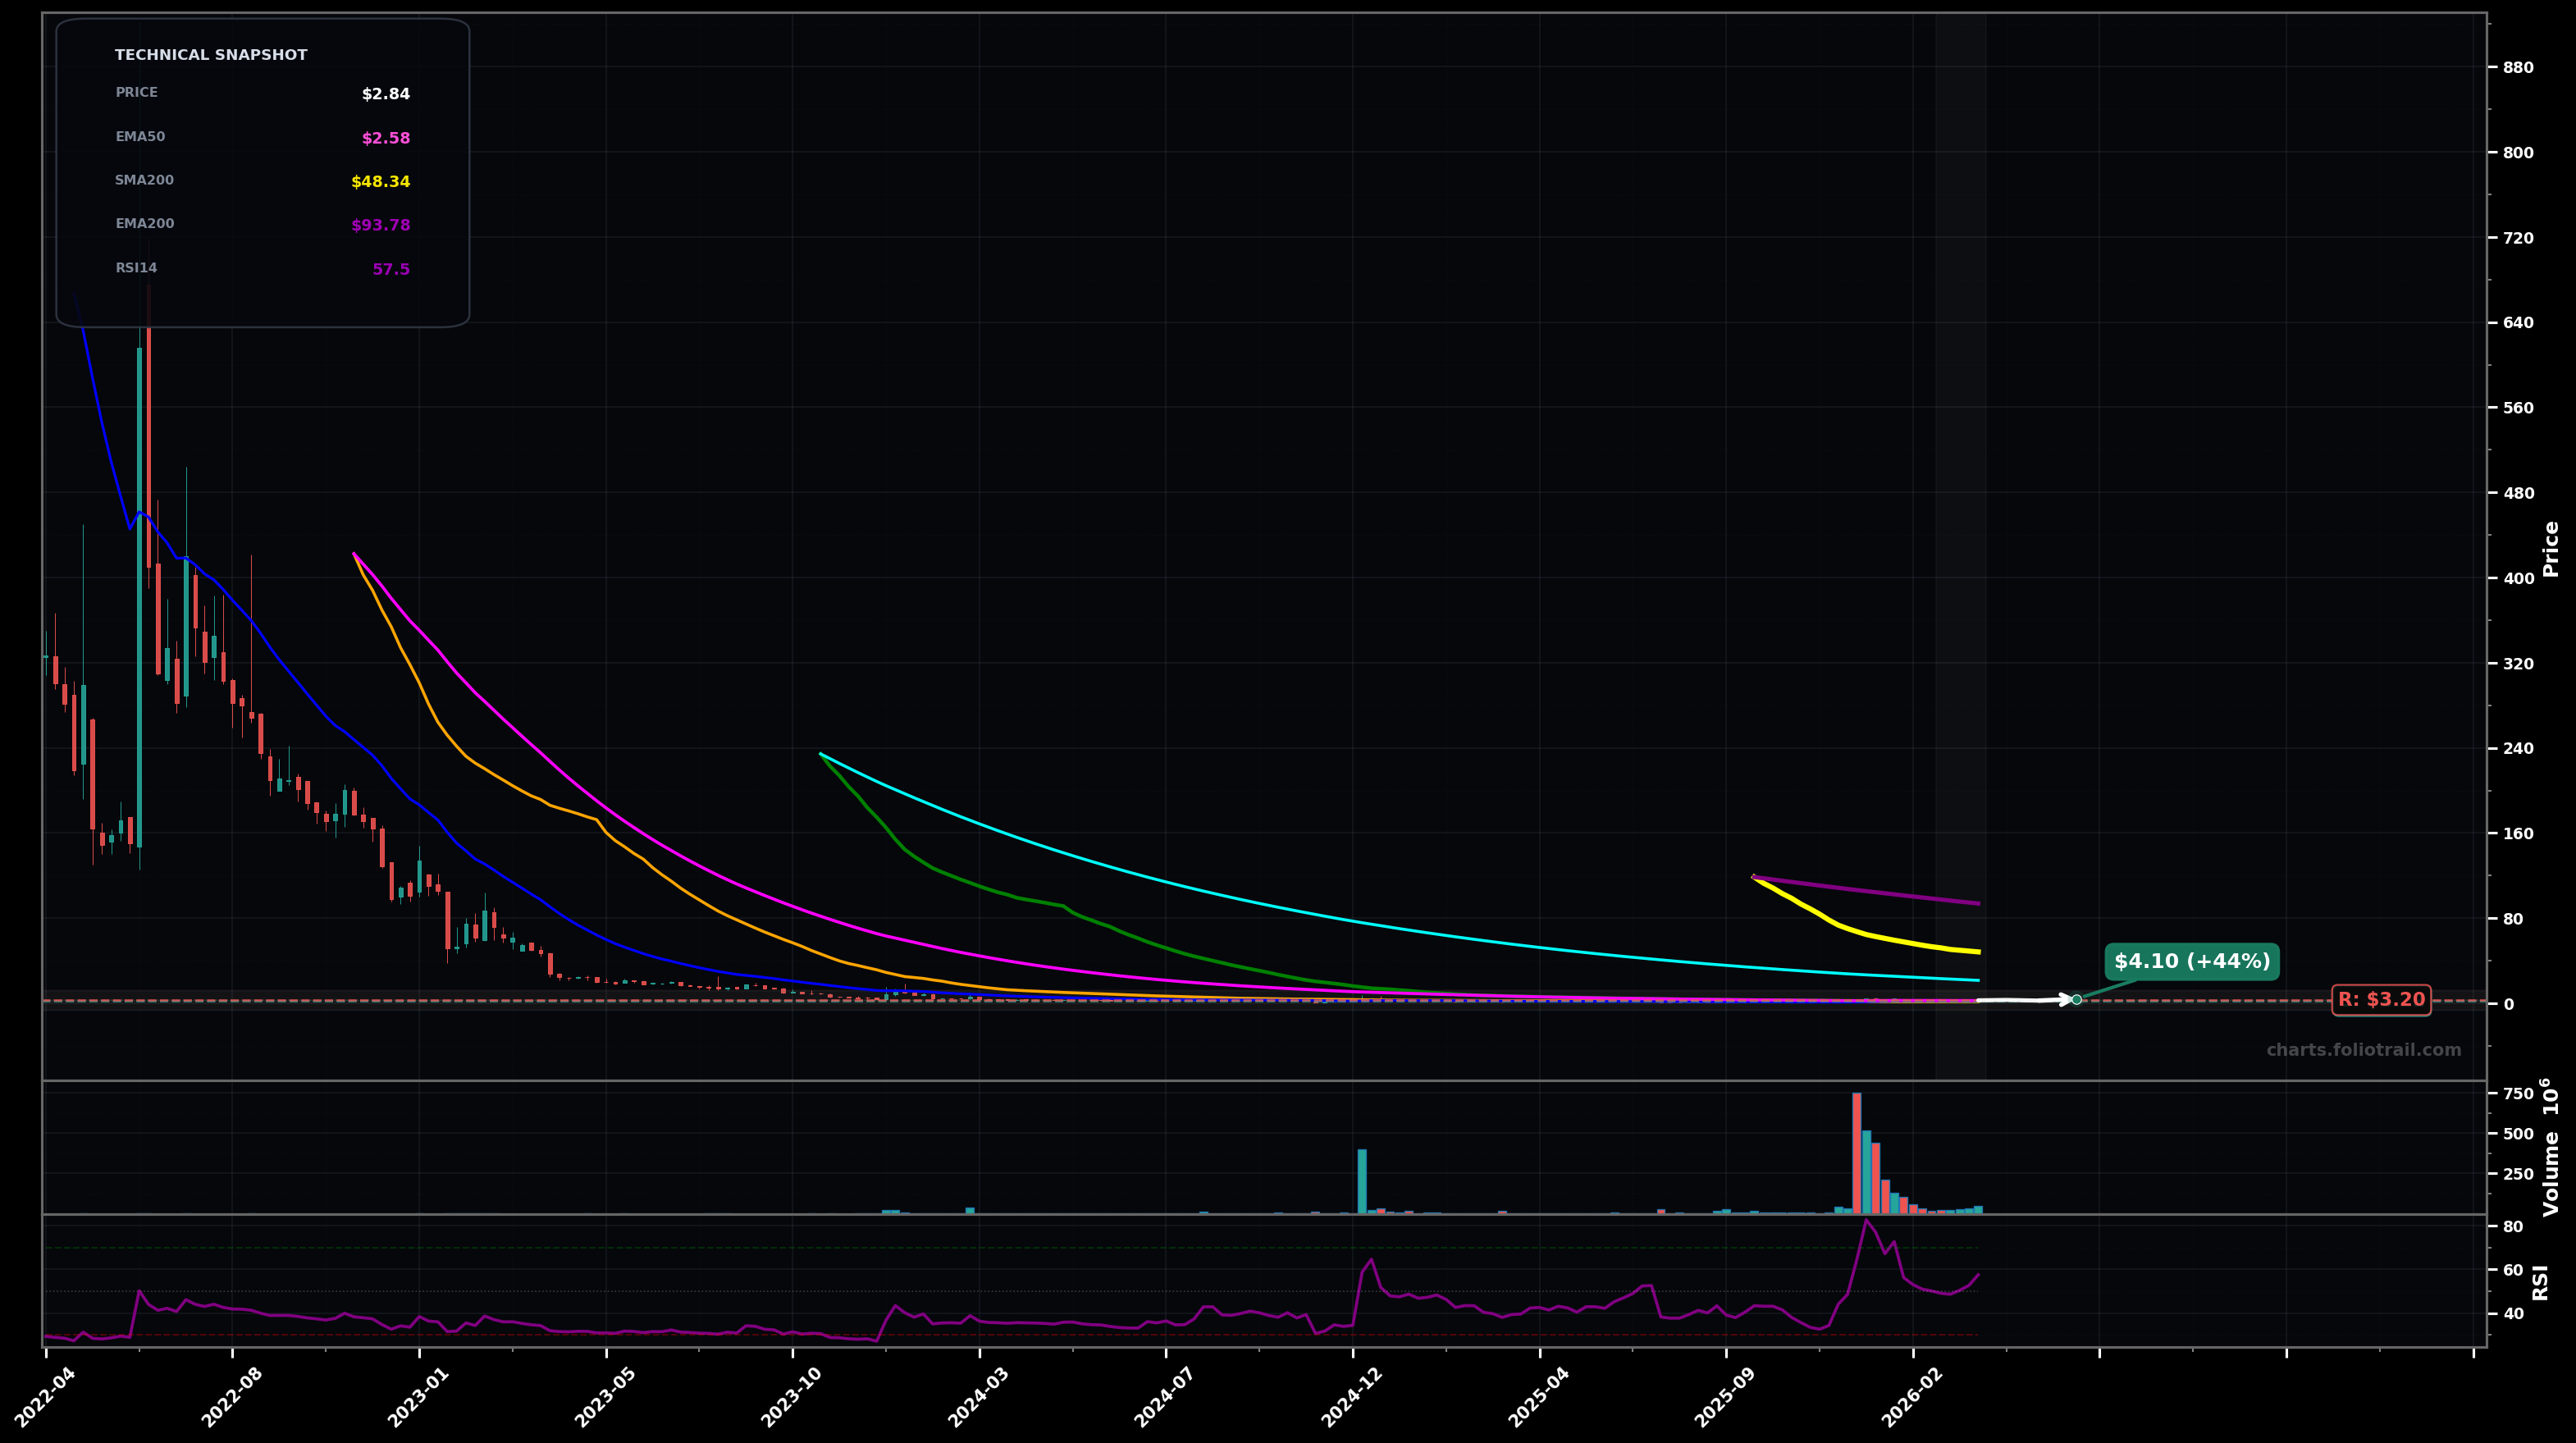
As of March 26, 2026, SIDU (Sidus Space Inc.) is in a bottoming attempt state on the weekly chart, with a confidence level of 66%. Key support is at $2.22 and key resistance at $3.20. After a long multi-year selloff, price is attempting to base near lows and is now trading above the short MAs (SMA50/100, EMA20/50) while still far below longer-term downtrend MAs (EMA100/200, SMA200).
Base-building with a bullish bias: pullback/hold above EMA20 then grind higher to retest the recent pivot zone and overhead supply near prior breakdown levels; wave-wise this fits an early basing structure (potential Elliott Wave 1 up, then wave 2 pullback, then attempt at wave 3).
Failure of the base: rejection at overhead supply (around $3.20-$4.10) and roll-over back into the lower range; would imply the move was a corrective ABC bounce within a larger bear trend (still below EMA100/200).
Weekly closes hold above $2.58 (EMA50) and break/hold above $3.20.
Weekly close below $2.22 (EMA20) followed by a break under $2.00.
Start near EMA20/EMA50 support confluence; add on deeper pullbacks into the base; heavy add only on a flush into prior swing-low demand (risk of renewed LL).
Trim into overhead supply where prior holders may exit (especially while price remains below EMA100/200); progressively more trimming if an impulsive rally stretches far above EMA50/100 and reaches major prior distribution zones.
As of March 26, 2026, SIDU (Sidus Space Inc.) is in a bottoming attempt state on the weekly chart with 66% confidence. After a long multi-year selloff, price is attempting to base near lows and is now trading above the short MAs (SMA50/100, EMA20/50) while still far below longer-term downtrend MAs (EMA100/200, SMA200).
On the weekly timeframe, SIDU has key support at $2.22 and key resistance at $3.20. The most likely scenario (bullish) targets $3.20 and $4.10, with a revert level at $2.60.
SIDU (Sidus Space Inc.) is currently classified as bottoming attempt on the weekly chart, with 66% confidence. Confirmation requires: Weekly closes hold above $2.58 (EMA50) and break/hold above $3.20. This would be invalidated by: Weekly close below $2.22 (EMA20) followed by a break under $2.00.
The most likely scenario (bullish) targets $3.20 and $4.10, with a revert level at $2.60. The alternative scenario (bearish) targets $2.22 and $1.70.
Multi-layer AI agents analyse 200+ stocks across daily, weekly, and monthly timeframes — producing market state classifications, price scenarios with targets, and position entry/exit levels. Updated every trading day after market close. No paywall. No sign-up required.
Built by Foliotrail.
All content on this website — including charts, analysis, price targets, support/resistance levels, and position zones — is generated entirely by AI and provided for educational and informational purposes only.
This is not financial advice. NEXUSNOIR VENTURES SL (the operator of this website) is not a registered investment adviser or broker-dealer. You should not make investment decisions based solely on this information. Always do your own research and consult a qualified financial advisor.
By continuing, you acknowledge that you have read and agree to our full disclaimer & terms of use and privacy policy.