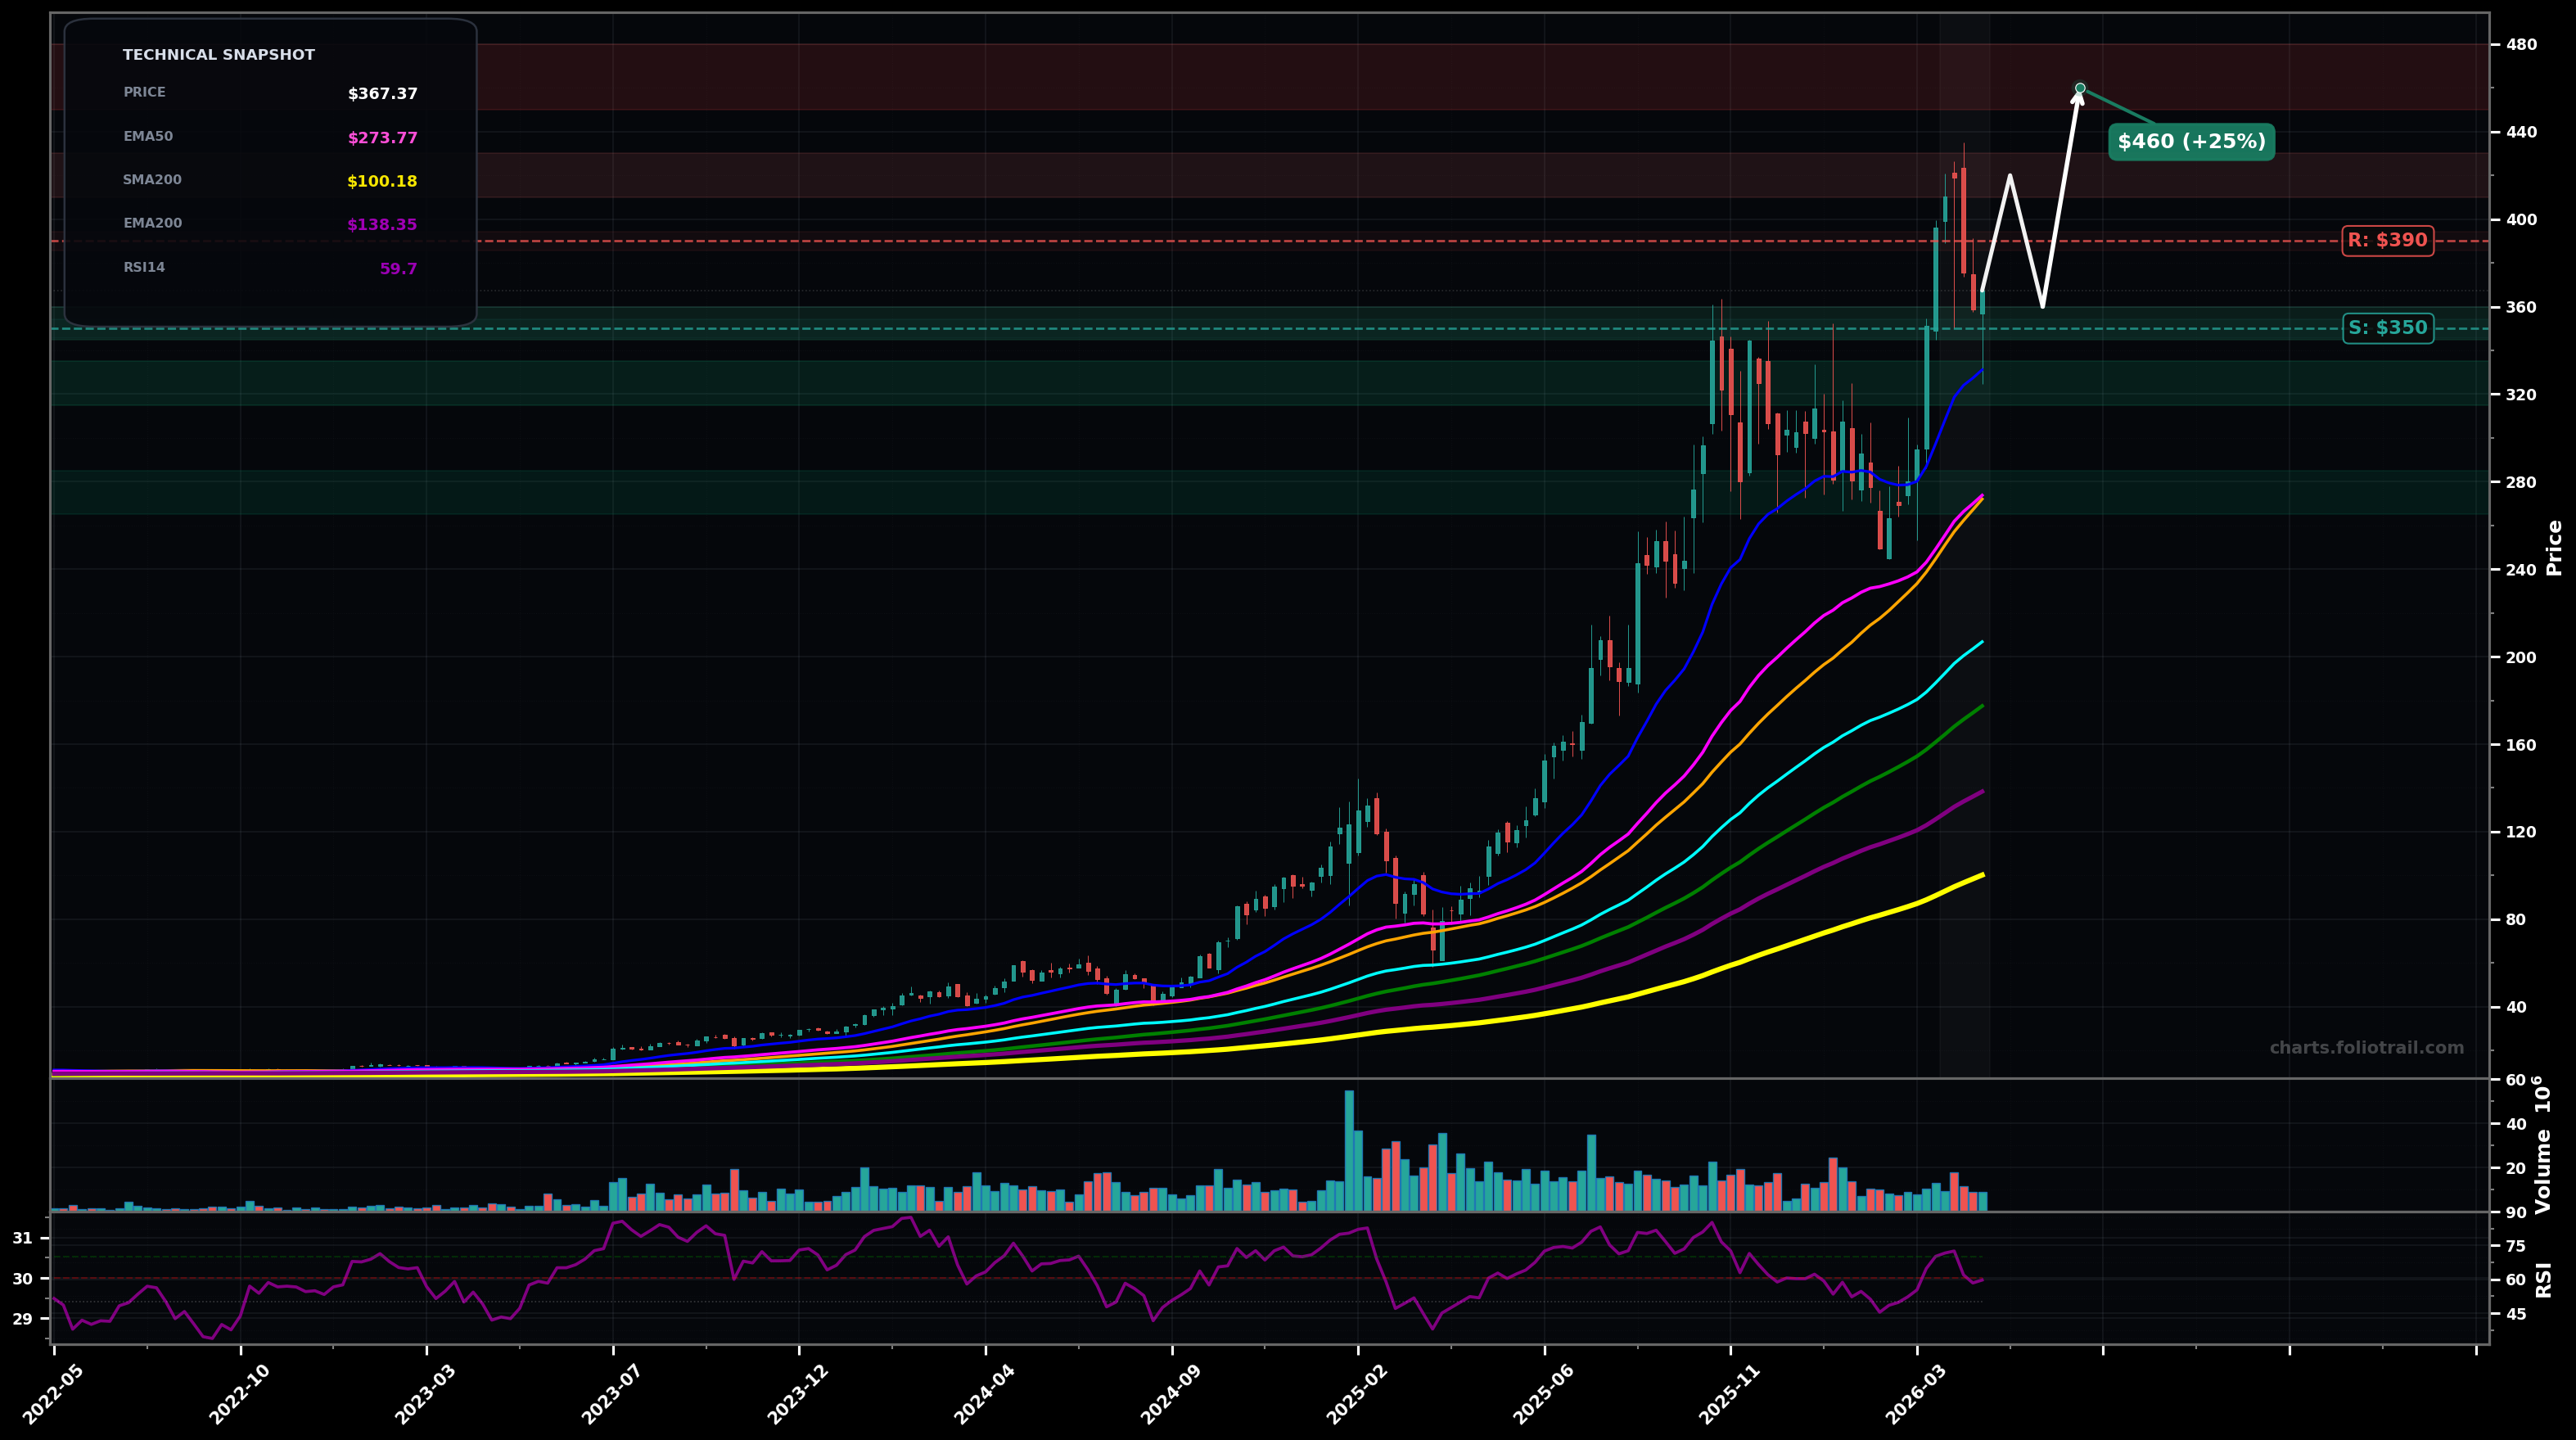
As of May 22, 2026, CLS (Celestica Inc.) is in a uptrend state on the weekly chart, with a confidence level of 72%. Key support is at $350 and key resistance at $390. After a sharp breakout to new highs near ~$420, CLS is pulling back to ~$367 while still holding well above the rising EMA50 (~$274) and prior breakout area; RSI ~60 suggests momentum cooled but remains constructive.
Base between ~$350–$390, then attempt to reclaim $390 and retest the prior high zone; Elliott view: likely consolidating as wave 4 before a final wave 5 push; Fibonacci: pullback is consistent with a shallow 23.6–38.2% retrace of the ~$270→~$420 leg, with buyers defending above the EMA20/EMA50 region.
Deeper weekly correction: lose ~$350 support and mean-revert toward the rising EMA50/SMA50 cluster; Elliott view: wave 4 morphs into a more complex ABC (sideways-to-down) before trend resumes; Fibonacci: extension down toward the 38.2–50% retrace zone of the last impulse becomes likely.
Weekly close back above $390 would confirm continuation after the pullback.
Weekly close below $330 would suggest the pullback is turning into a deeper trend change risk.
Scale near weekly demand at ~$350 first; add on breakdown/retest of ~$330; heavy add at EMA50/SMA50 confluence (~$274) where trend support should be strongest if the primary uptrend remains intact.
Trim into prior-high supply ($420 zone) and potential wave-5 extension ($450–$480); fully exit only on an oversized multi-year extension well above the MA bundle (blow-off risk) around $520+.
As of May 22, 2026, CLS (Celestica Inc.) is in a uptrend state on the weekly chart with 72% confidence. After a sharp breakout to new highs near ~$420, CLS is pulling back to ~$367 while still holding well above the rising EMA50 (~$274) and prior breakout area; RSI ~60 suggests momentum cooled but remains constructive.
On the weekly timeframe, CLS has key support at $350 and key resistance at $390. The most likely scenario (bullish) targets $420 and $460, with a revert level at $360.
CLS (Celestica Inc.) is currently classified as uptrend on the weekly chart, with 72% confidence. Confirmation requires: Weekly close back above $390 would confirm continuation after the pullback. This would be invalidated by: Weekly close below $330 would suggest the pullback is turning into a deeper trend change risk.
The most likely scenario (bullish) targets $420 and $460, with a revert level at $360. The alternative scenario (bearish) targets $330 and $275.
Multi-layer AI agents analyse 200+ stocks across daily, weekly, and monthly timeframes — producing market state classifications, price scenarios with targets, and position entry/exit levels. Daily charts updated every trading day at 6 PM ET. Weekly charts refresh Fridays. Monthly charts refresh on the last trading day of each month. No paywall. No sign-up required.
Built by Foliotrail.
All content on this website — including charts, analysis, price targets, support/resistance levels, and position zones — is generated entirely by AI and provided for educational and informational purposes only.
This is not financial advice. NEXUSNOIR VENTURES SL (the operator of this website) is not a registered investment adviser or broker-dealer. You should not make investment decisions based solely on this information. Always do your own research and consult a qualified financial advisor.
By continuing, you acknowledge that you have read and agree to our full disclaimer & terms of use and privacy policy.