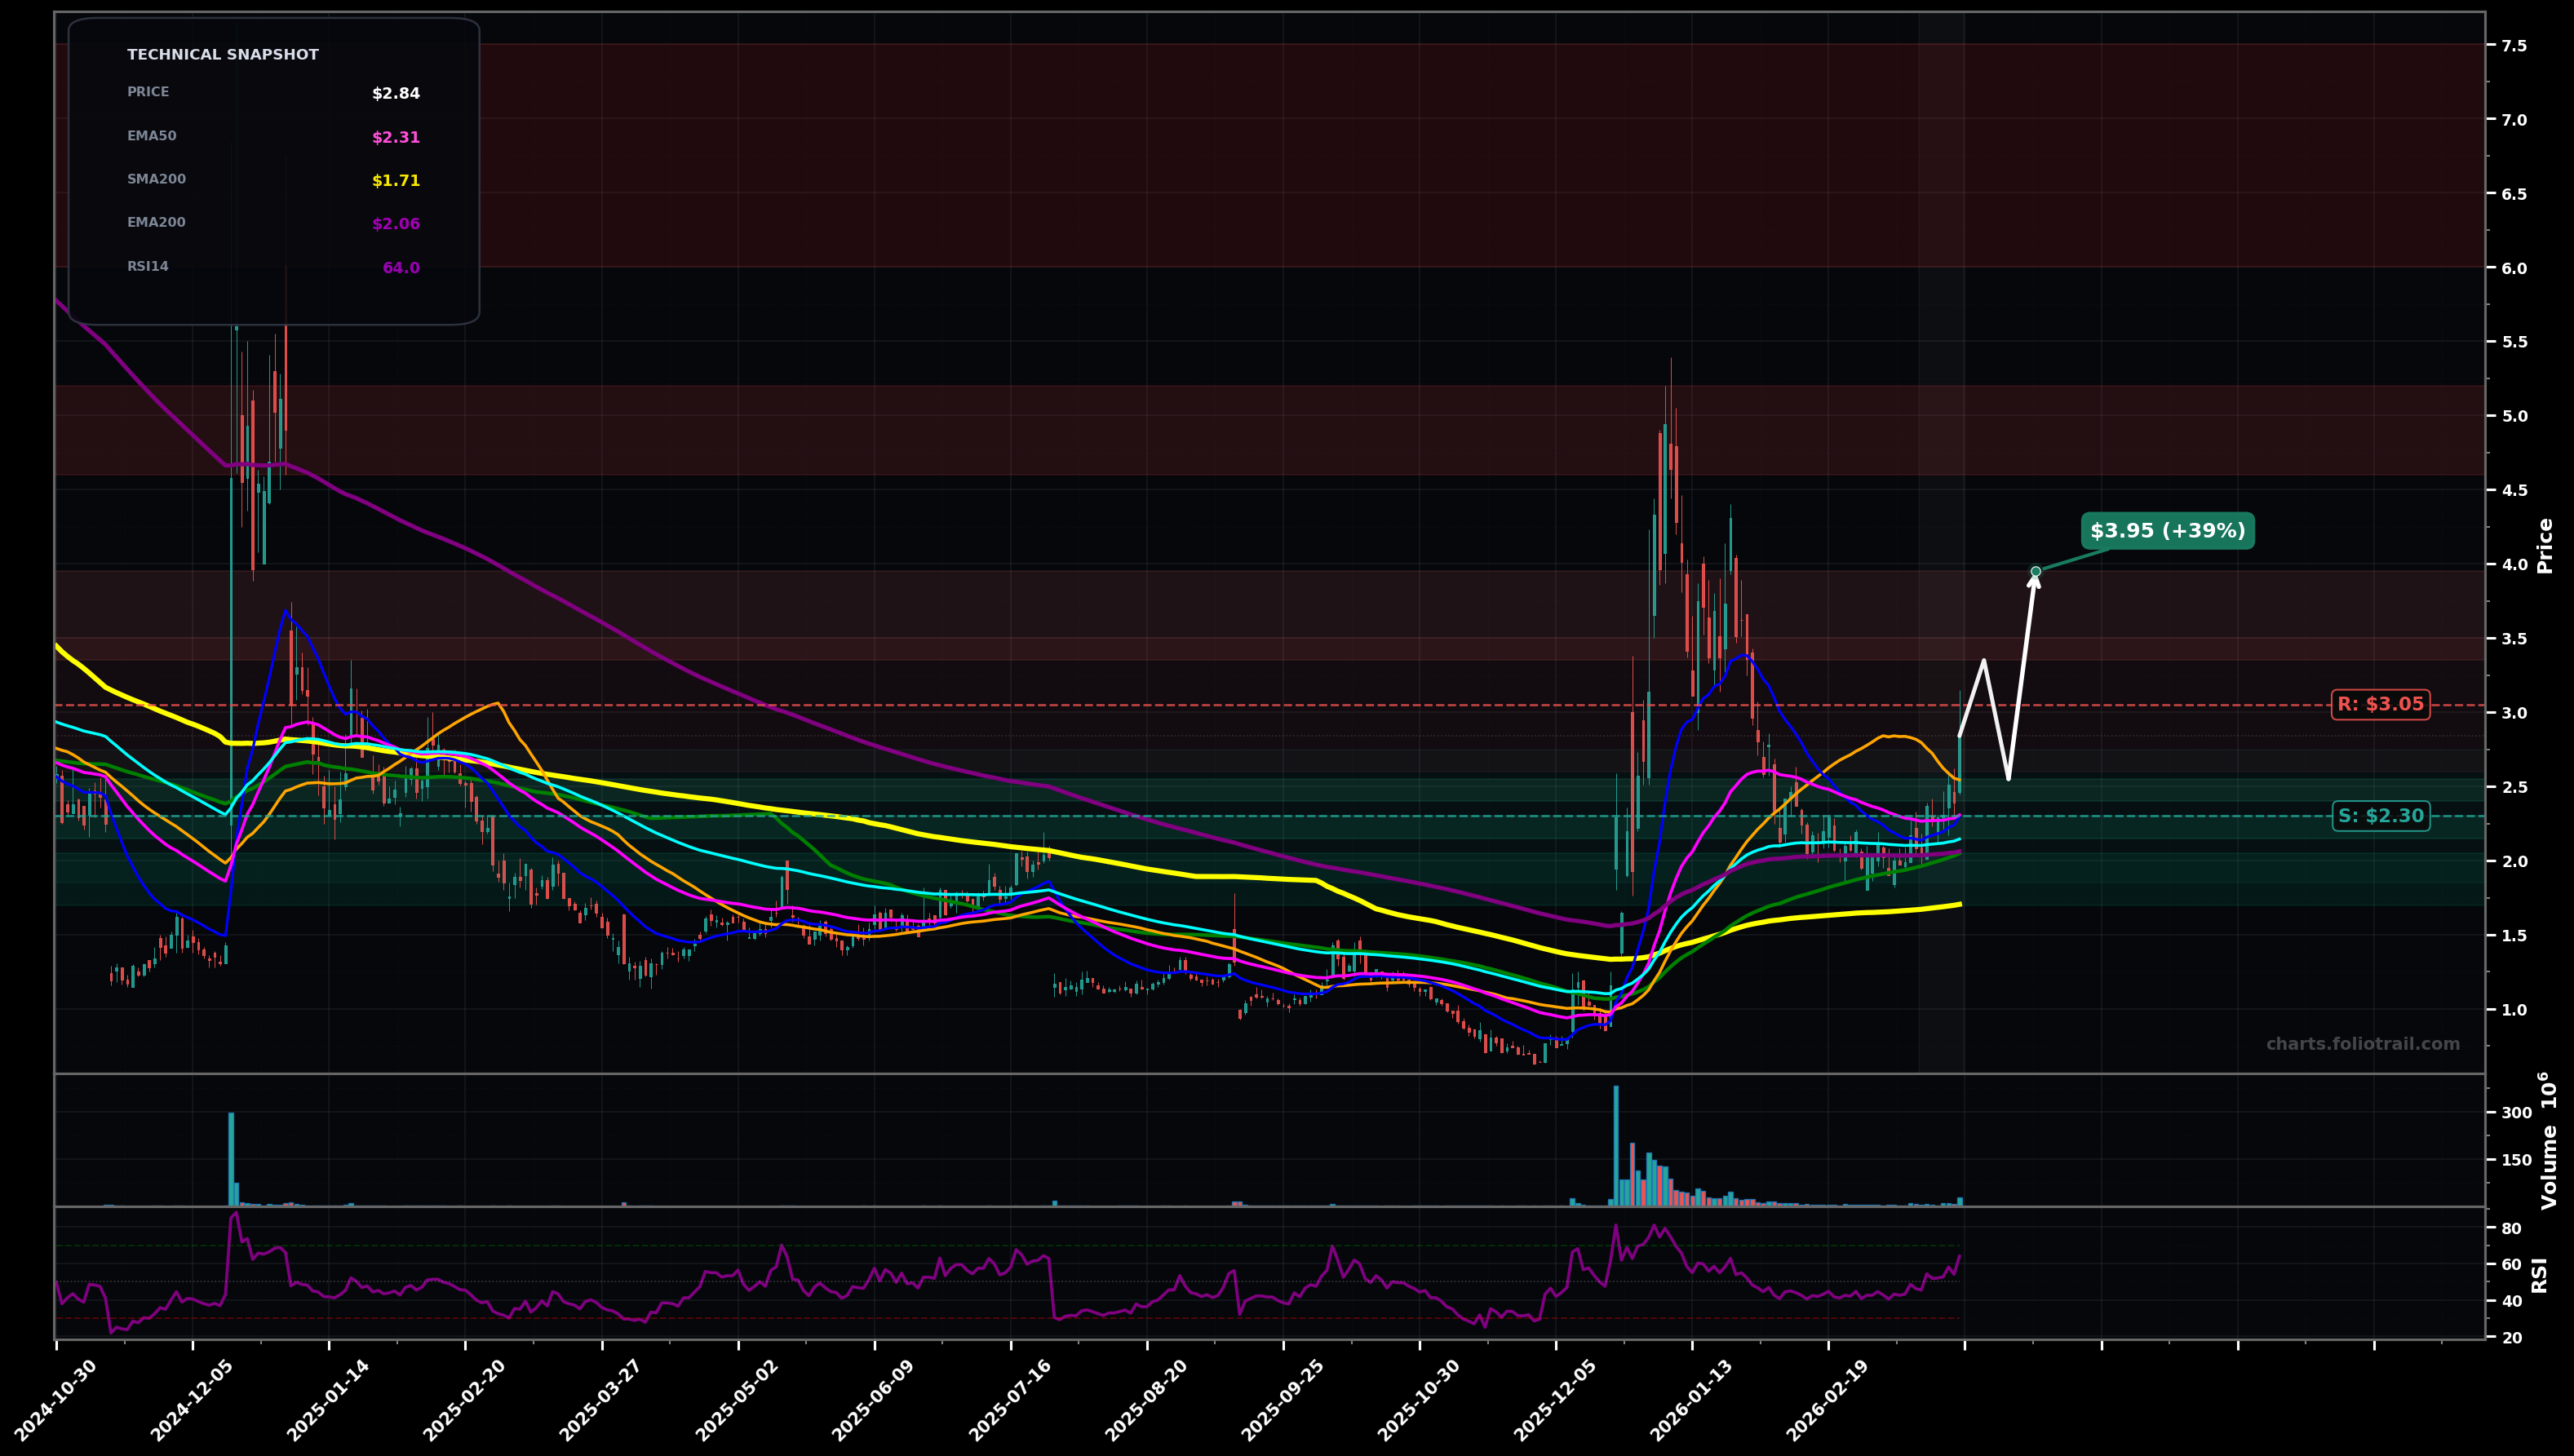
As of March 26, 2026, SIDU (Sidus Space Inc.) is in a breakout reversal state on the daily chart, with a confidence level of 63%. Key support is at $2.30 and key resistance at $3.05. Price at $2.84 pushed up and is holding above clustered short/mid MAs (EMA50/100/200 and SMA50/100), challenging the recent supply zone near $3.00+.
Bullish continuation: price consolidates above $2.30–$2.55, then breaks $3.05 and trends toward the next Fibonacci/structure resistance from the prior impulse leg.
Bearish failure/bull trap: rejection near $3.05–$3.35 leads to a pullback into the moving-average cluster; if $2.30 breaks, mean reversion continues toward the base support.
2+ daily closes above $3.05 holding as support
Daily close back below $2.30 (loss of EMA50/EMA20 area) with follow-through
Buy-on-dips favored while above reclaimed EMA50/100; heavier adds near prior base/MA supports (SMA100 ~$2.05, SMA200 ~$1.71) if a deeper retest occurs.
Trim into prior supply/impulse retracement levels: first near $3.35–$3.95, more into the post-spike resistance band $4.6–$5.2, and exit into extreme extension toward the prior blow-off zone $6+.
As of March 26, 2026, SIDU (Sidus Space Inc.) is in a breakout reversal state on the daily chart with 63% confidence. Price at $2.84 pushed up and is holding above clustered short/mid MAs (EMA50/100/200 and SMA50/100), challenging the recent supply zone near $3.00+.
On the daily timeframe, SIDU has key support at $2.30 and key resistance at $3.05. The most likely scenario (bullish) targets $3.35 and $3.95, with a revert level at $2.55.
SIDU (Sidus Space Inc.) is currently classified as breakout reversal on the daily chart, with 63% confidence. Confirmation requires: 2+ daily closes above $3.05 holding as support This would be invalidated by: Daily close back below $2.30 (loss of EMA50/EMA20 area) with follow-through
The most likely scenario (bullish) targets $3.35 and $3.95, with a revert level at $2.55. The alternative scenario (bearish) targets $2.05 and $1.70.
Multi-layer AI agents analyse 200+ stocks across daily, weekly, and monthly timeframes — producing market state classifications, price scenarios with targets, and position entry/exit levels. Updated every trading day after market close. No paywall. No sign-up required.
Built by Foliotrail.
All content on this website — including charts, analysis, price targets, support/resistance levels, and position zones — is generated entirely by AI and provided for educational and informational purposes only.
This is not financial advice. NEXUSNOIR VENTURES SL (the operator of this website) is not a registered investment adviser or broker-dealer. You should not make investment decisions based solely on this information. Always do your own research and consult a qualified financial advisor.
By continuing, you acknowledge that you have read and agree to our full disclaimer & terms of use and privacy policy.