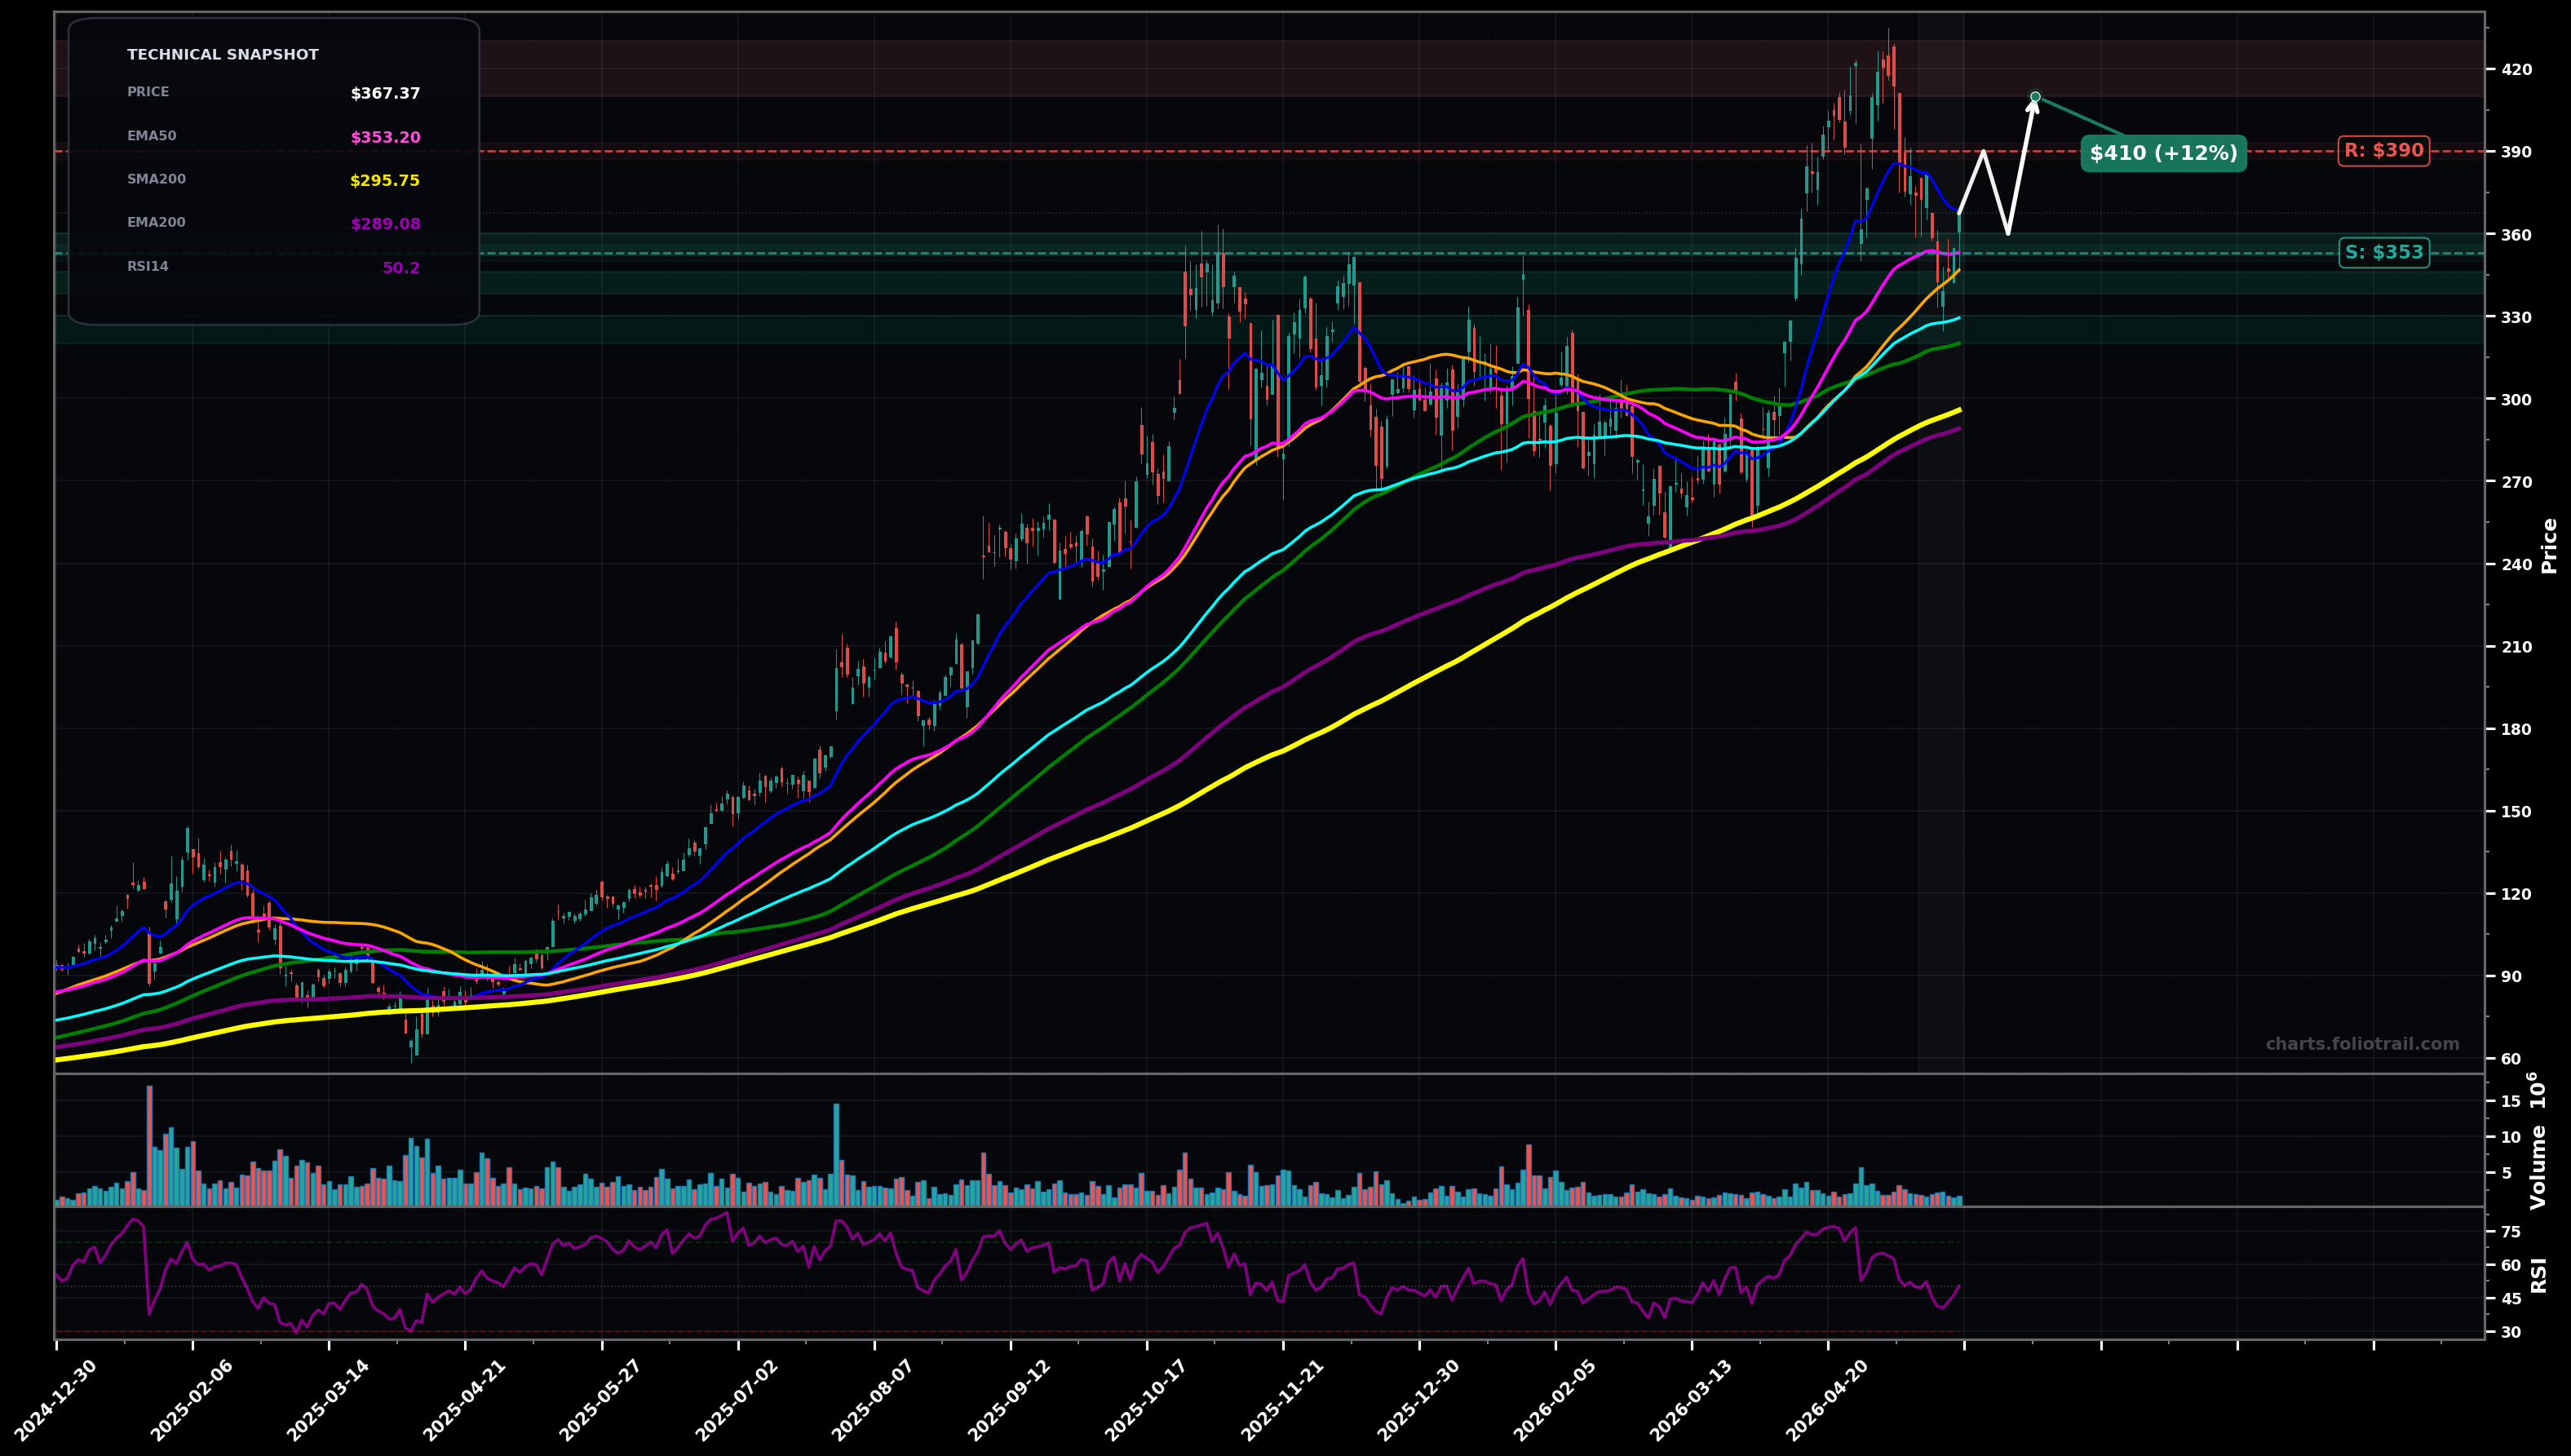
As of May 22, 2026, CLS (Celestica Inc.) is in a bottoming attempt state on the daily chart, with a confidence level of 63%. Key support is at $353 and key resistance at $390. Sharp pullback from the ~$430 swing high into the EMA50 (~$353) area; latest price ~$367 is holding above EMA50/SMA50 with RSI ~50 (neutral).
Base forms above EMA50/SMA50, then a grind higher retests the breakdown area near $390; if accepted, price can push into the prior supply zone.
Bear flag/rejection under ~$390, then rollover back into the moving-average cluster; loss of EMA50/SMA50 triggers a deeper retrace toward EMA100/SMA100.
Daily close above $390 followed by a second close holding >$390
Daily close below $346
Layer bids at EMA50/SMA50 confluence first, add on a controlled breakdown into prior pivot/support and EMA100/SMA100 area, heavy add only if price tags the deeper mean-reversion zone while holding structure.
Trim into the prior swing-high supply ($410-$430), increase trimming if price becomes extended above rising long MAs, and fully exit only on a multi-year stretch/mania extension well above the moving-average stack.
As of May 22, 2026, CLS (Celestica Inc.) is in a bottoming attempt state on the daily chart with 63% confidence. Sharp pullback from the ~$430 swing high into the EMA50 (~$353) area; latest price ~$367 is holding above EMA50/SMA50 with RSI ~50 (neutral).
On the daily timeframe, CLS has key support at $353 and key resistance at $390. The most likely scenario (bullish) targets $390 and $410, with a revert level at $360.
CLS (Celestica Inc.) is currently classified as bottoming attempt on the daily chart, with 63% confidence. Confirmation requires: Daily close above $390 followed by a second close holding >$390 This would be invalidated by: Daily close below $346
The most likely scenario (bullish) targets $390 and $410, with a revert level at $360. The alternative scenario (bearish) targets $346 and $330.
Multi-layer AI agents analyse 200+ stocks across daily, weekly, and monthly timeframes — producing market state classifications, price scenarios with targets, and position entry/exit levels. Daily charts updated every trading day at 6 PM ET. Weekly charts refresh Fridays. Monthly charts refresh on the last trading day of each month. No paywall. No sign-up required.
Built by Foliotrail.
All content on this website — including charts, analysis, price targets, support/resistance levels, and position zones — is generated entirely by AI and provided for educational and informational purposes only.
This is not financial advice. NEXUSNOIR VENTURES SL (the operator of this website) is not a registered investment adviser or broker-dealer. You should not make investment decisions based solely on this information. Always do your own research and consult a qualified financial advisor.
By continuing, you acknowledge that you have read and agree to our full disclaimer & terms of use and privacy policy.