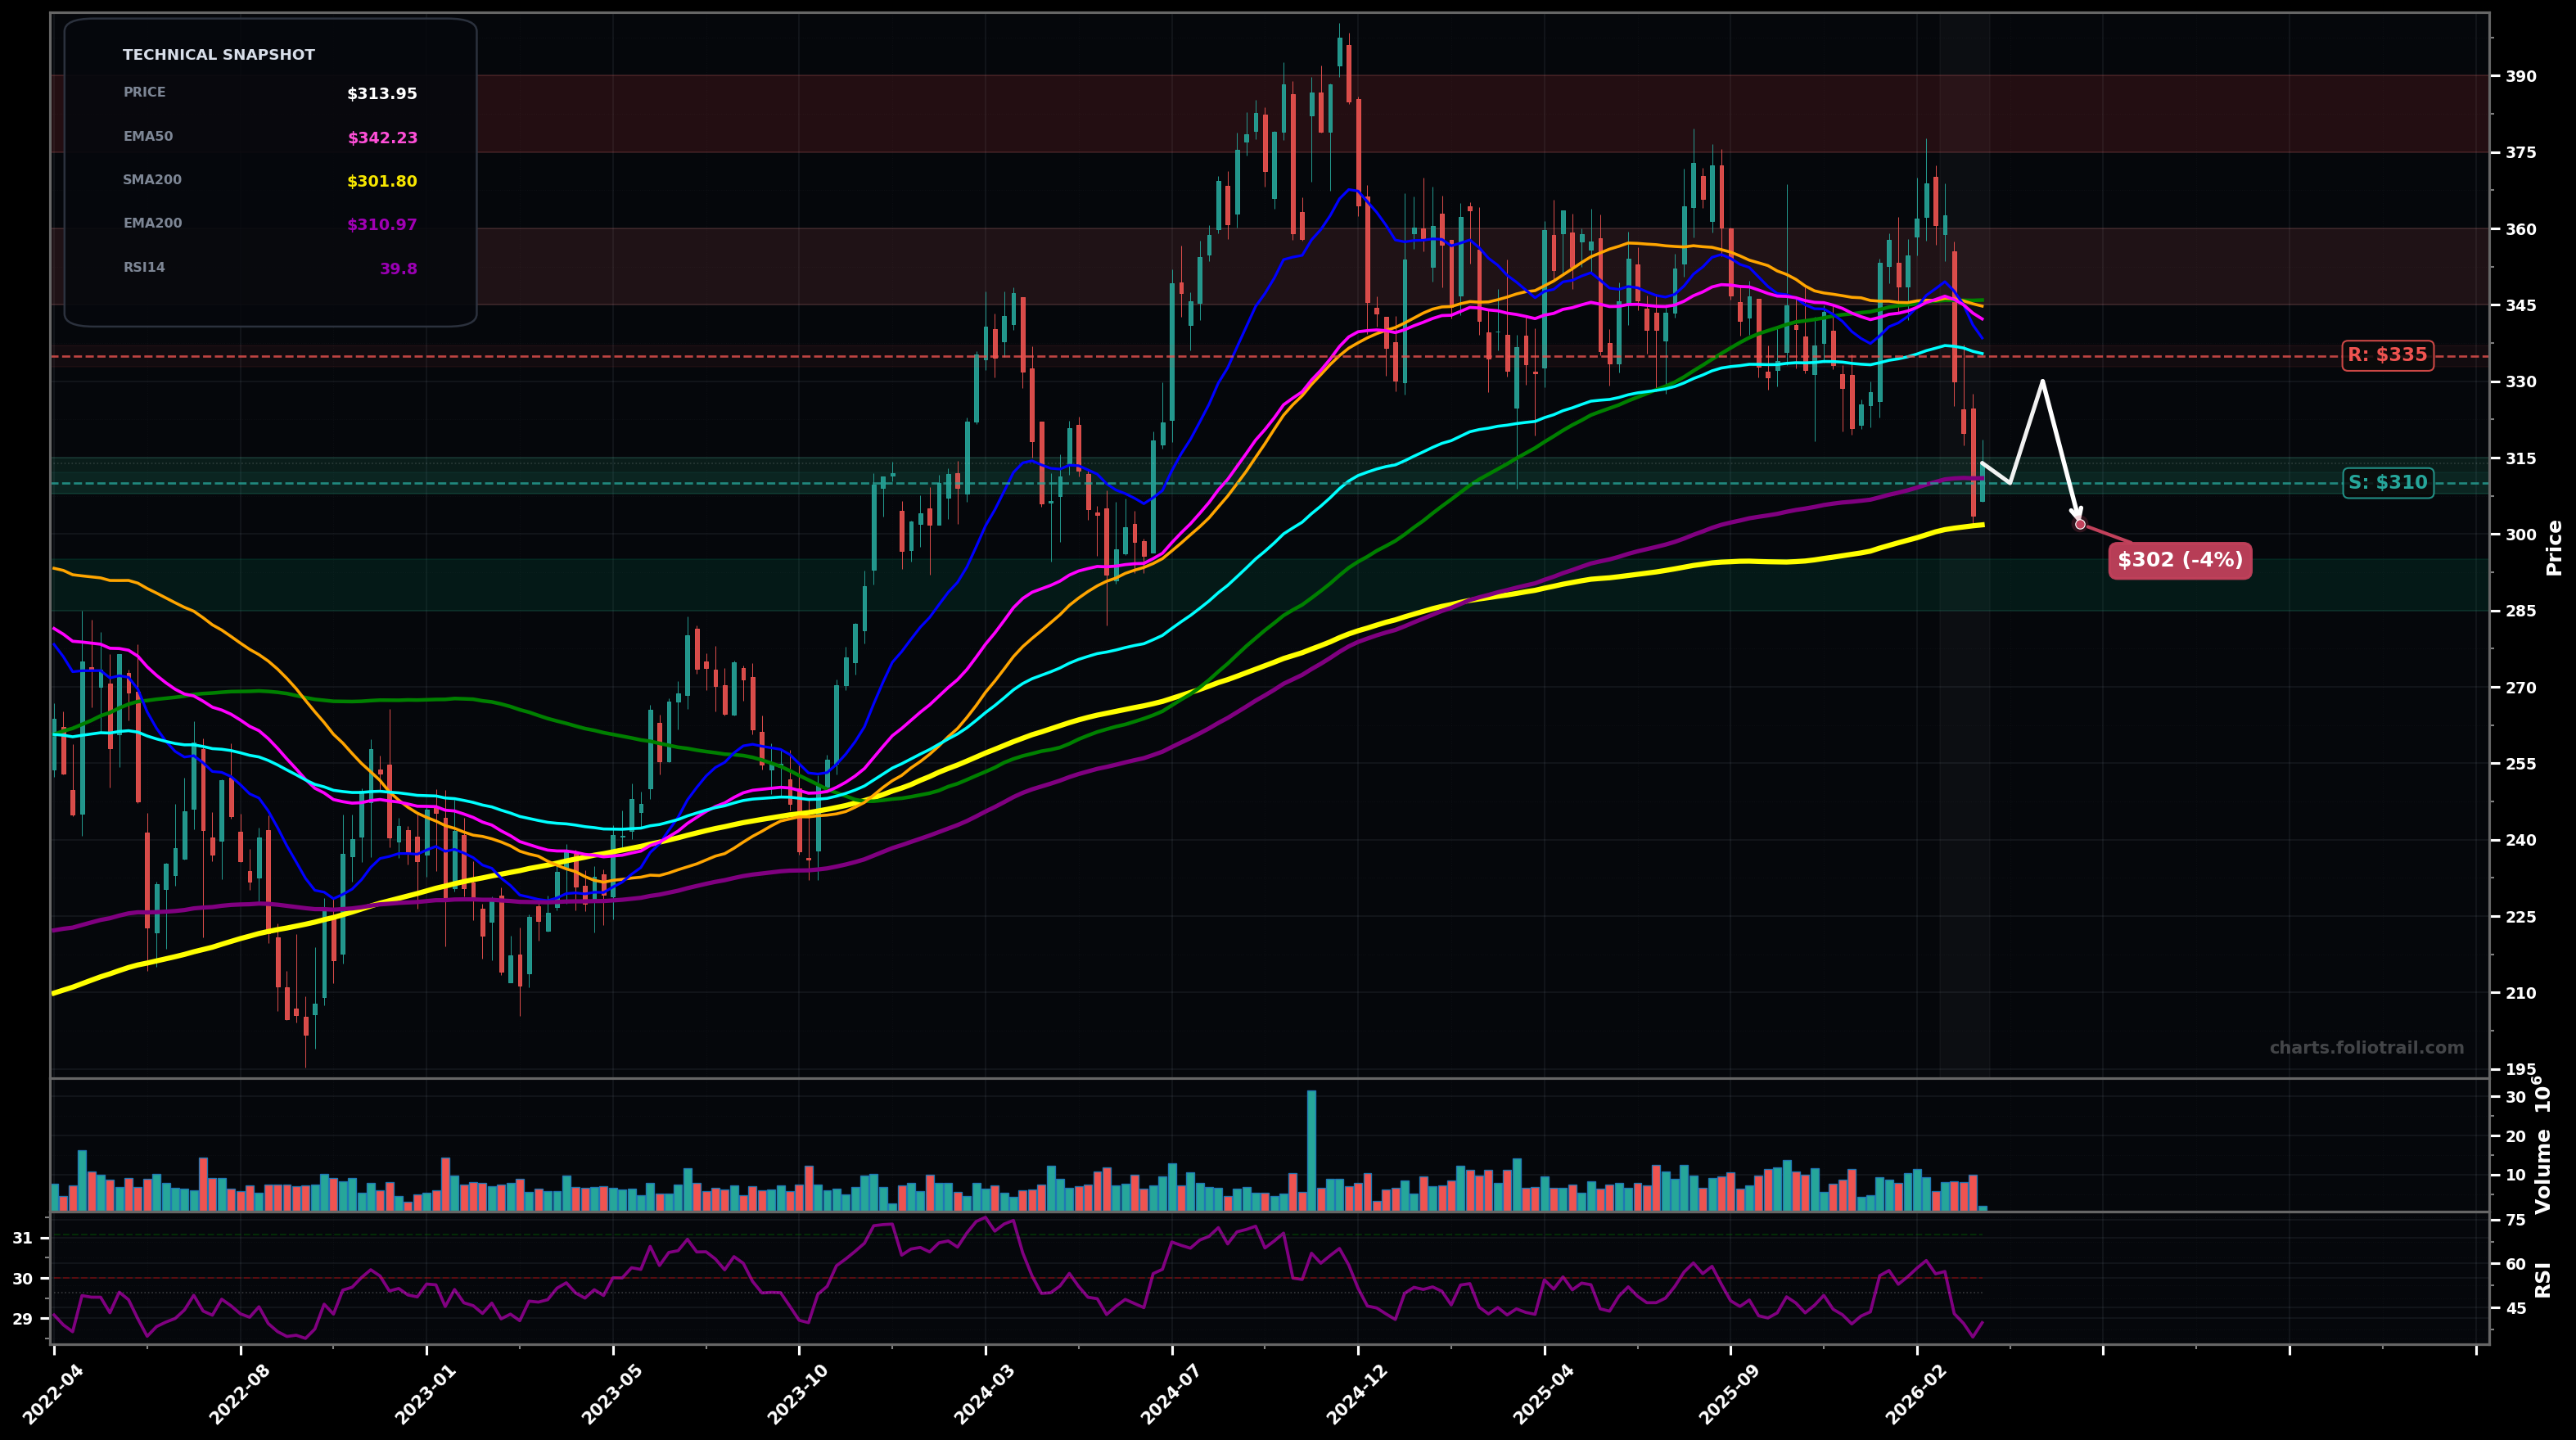
As of March 24, 2026, SHW (The Sherwin-Williams Company) is in a downtrend state on the weekly chart, with a confidence level of 66%. Key support is at $310 and key resistance at $335. Weekly breakdown: sharp red move from the $340-$350 cluster, now trading below EMA50/EMA100 and under the prior range support; momentum weak (RSI ~40).
Bear continuation: breakdown follows through toward the long-term MA shelf (EMA200/SMA200 zone), then a weak bounce/retest fails under ~$330-$335.
Bullish mean-reversion: undercut/hold of the $310 area sparks a bounce back into the prior range, attempting a reclaim of EMA100 and then EMA50.
Weekly close below $310 (EMA200 area) would confirm downside continuation
Weekly close back above $335 (EMA100) would invalidate the immediate bearish breakdown thesis
Start near confluence support (EMA200 ~$311 + round $310); add into $300-$306 (SMA200 ~$302) if held/recaptured; heavy add only on deeper capitulation toward the next demand shelf below the 200s.
Trim into reclaim of the broken range/MA cluster ($345-$360), trim more into prior cycle supply ($375-$390), and consider full exit if price becomes extended above prior highs into a likely Wave-5/overextension zone.
As of March 24, 2026, SHW (The Sherwin-Williams Company) is in a downtrend state on the weekly chart with 66% confidence. Weekly breakdown: sharp red move from the $340-$350 cluster, now trading below EMA50/EMA100 and under the prior range support; momentum weak (RSI ~40).
On the weekly timeframe, SHW has key support at $310 and key resistance at $335. The most likely scenario (bearish) targets $310 and $302, with a revert level at $330.
SHW (The Sherwin-Williams Company) is currently classified as downtrend on the weekly chart, with 66% confidence. Confirmation requires: Weekly close below $310 (EMA200 area) would confirm downside continuation This would be invalidated by: Weekly close back above $335 (EMA100) would invalidate the immediate bearish breakdown thesis
The most likely scenario (bearish) targets $310 and $302, with a revert level at $330. The alternative scenario (bullish) targets $335 and $345.
All content on this website — including charts, analysis, price targets, support/resistance levels, and position zones — is generated entirely by AI and provided for educational and informational purposes only.
This is not financial advice. NEXUSNOIR VENTURES SL (the operator of this website) is not a registered investment adviser or broker-dealer. You should not make investment decisions based solely on this information. Always do your own research and consult a qualified financial advisor.
By continuing, you acknowledge that you have read and agree to our full disclaimer & terms of use and privacy policy.