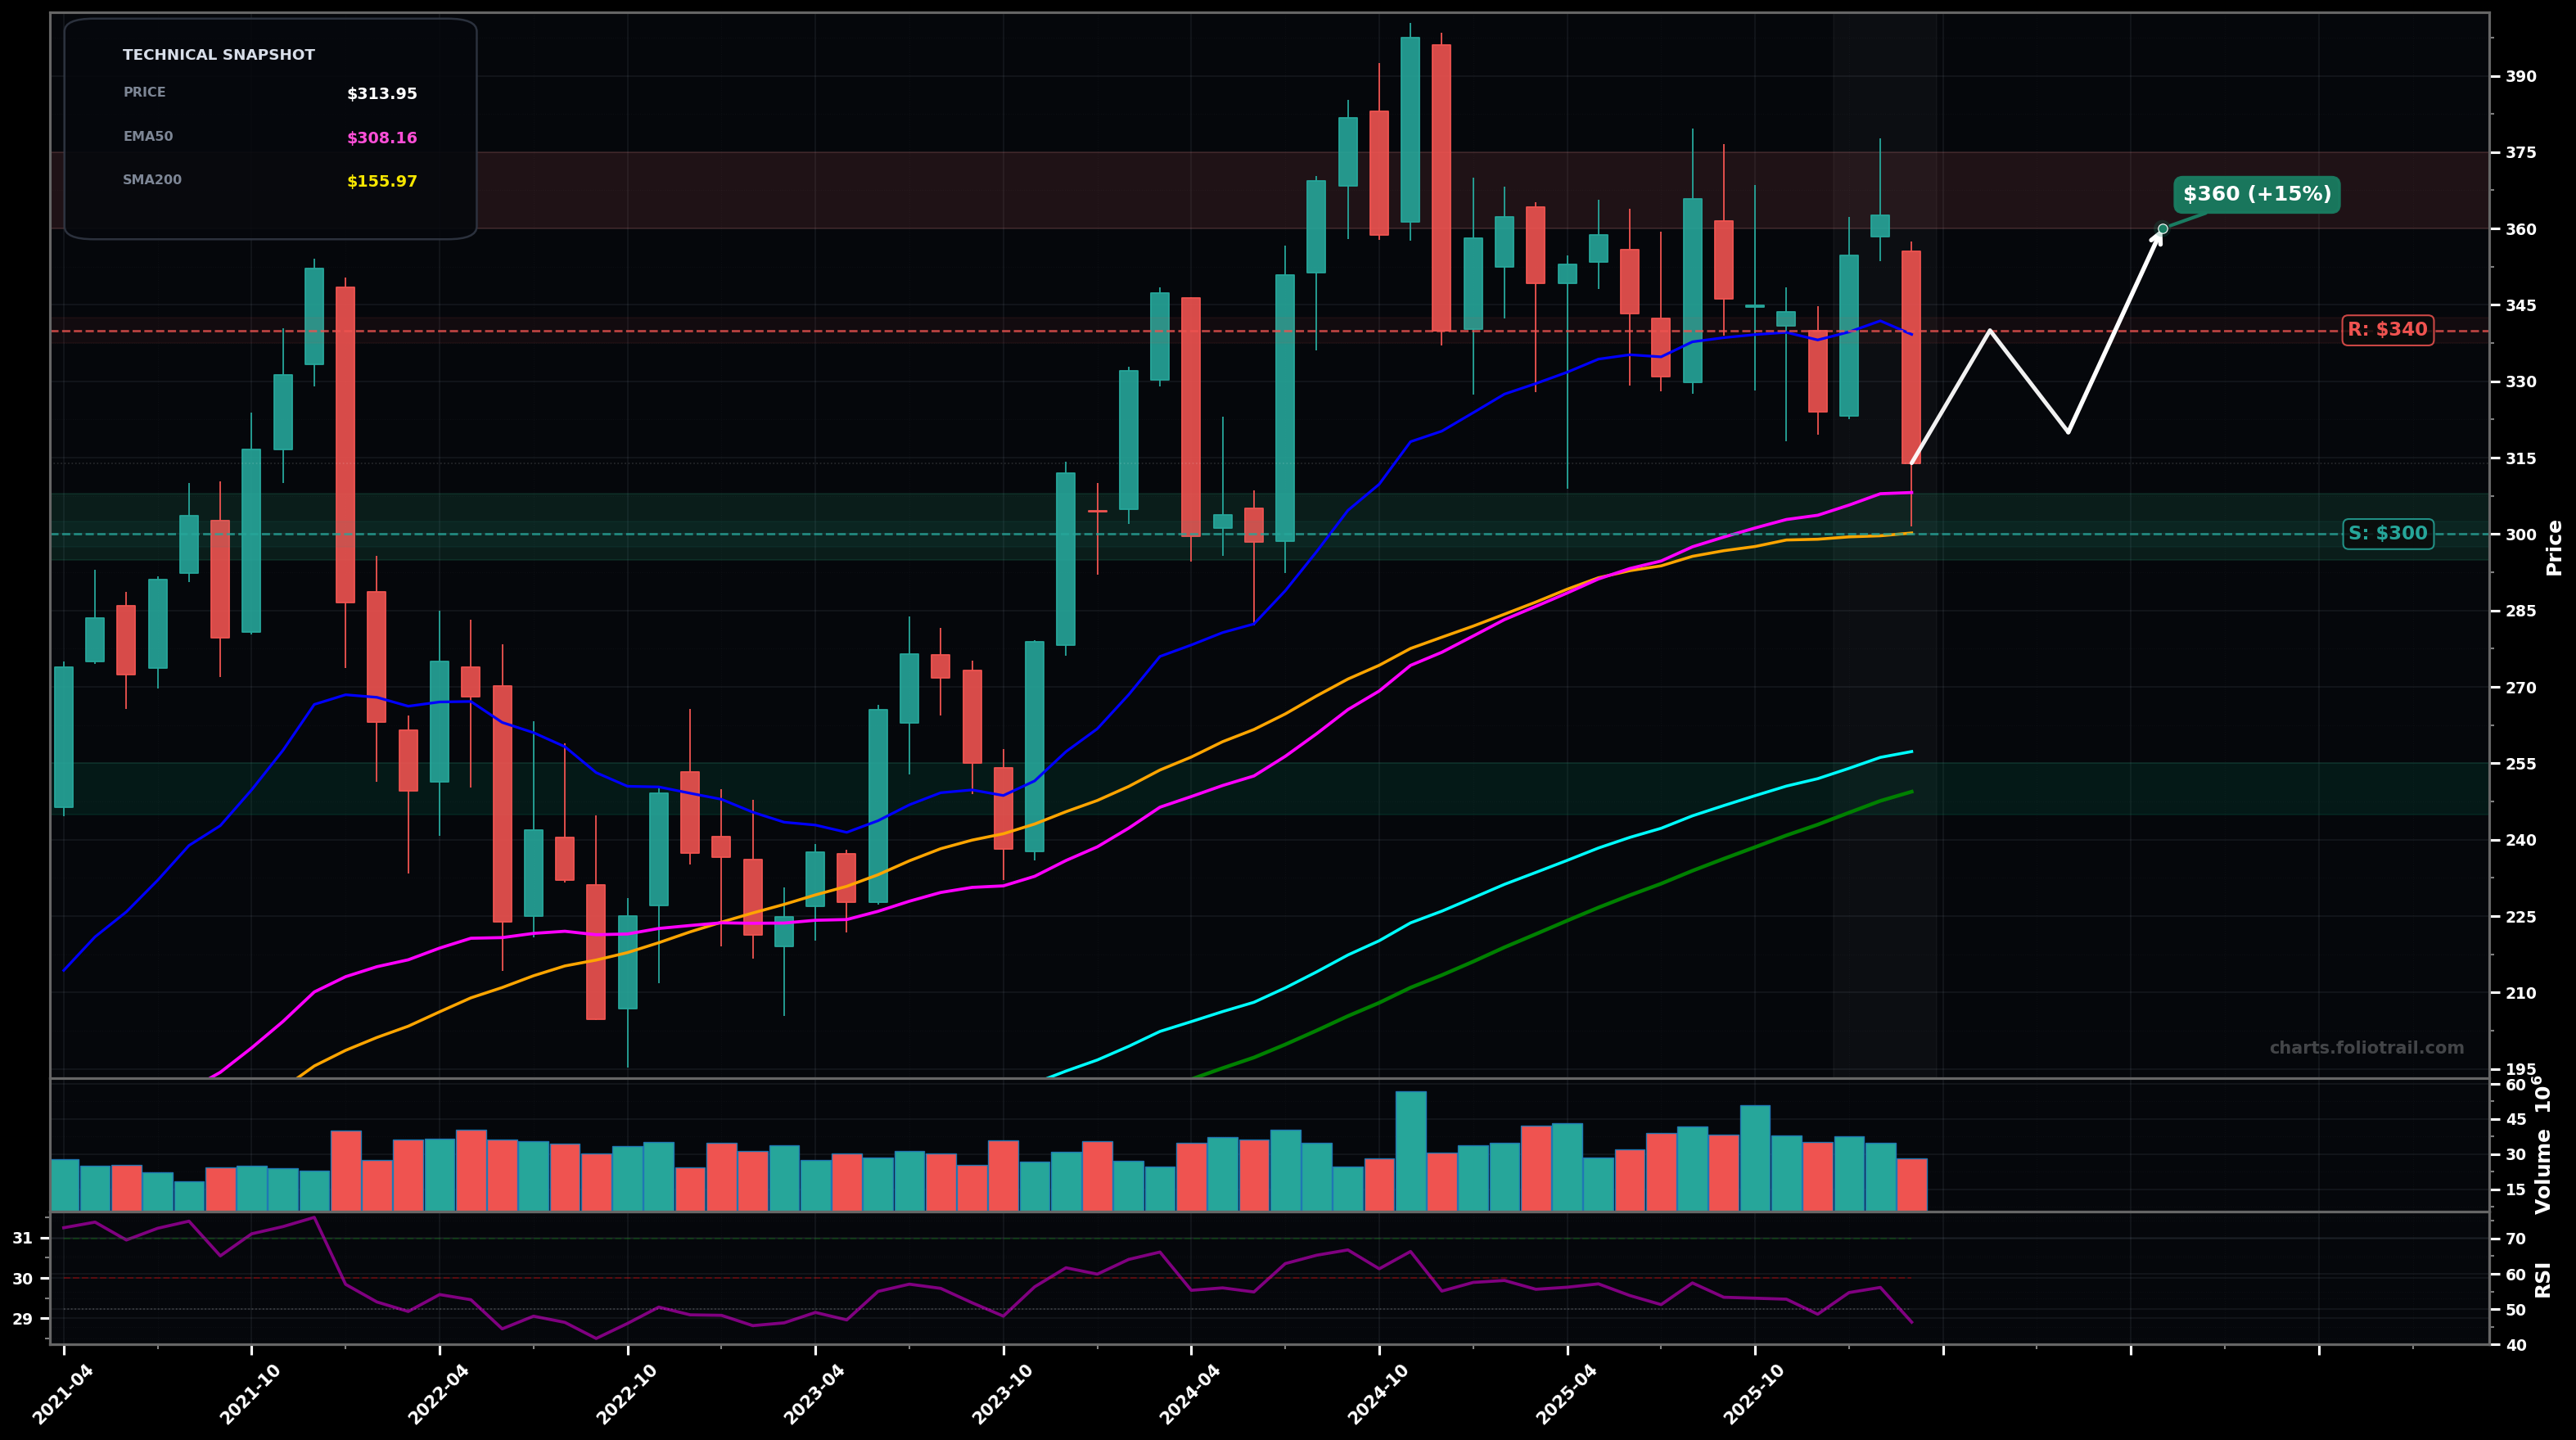
As of March 24, 2026, SHW (The Sherwin-Williams Company) is in a choppy range state on the monthly chart, with a confidence level of 62%. Key support is at $300 and key resistance at $340. Monthly selloff back into the $310-$300 area after repeated failures to hold above the $340-$360 band; momentum cools (RSI ~46) while price sits near rising intermediate MAs.
Range continuation: buyers defend the $300-$308 MA cluster (SMA50/EMA50), then a bounce back toward the middle/top of the range; expect chop and retests rather than a straight-line move. (Elliott: likely a corrective wave 4/complex ABC before the next directional leg.)
Range breaks down: failure to hold $300 triggers a deeper mean reversion toward the higher-timeframe trend supports (EMA100/SMA100 region), consistent with an ABC downswing extending. Fibonacci-wise, this would resemble a deeper retrace of the prior impulse (38.2%–61.8% zone).
Two monthly closes holding above $340 (reclaim of EMA20 zone) would confirm a breakout attempt from the range.
A monthly close below $300 would invalidate the range thesis and tilt to a renewed downtrend/knife risk toward the next supports.
Start near the $300 MA confluence (SMA50/EMA50); add on a breakdown toward the next demand shelf; heavy add near the EMA100/SMA100 cluster (~$257-$249) where long-term trend support is most likely.
Trim into range resistance ($360-$375) and prior swing-high supply (~$390+); close if price becomes meaningfully extended above the prior highs (blow-off/upper Fib extension risk).
As of March 24, 2026, SHW (The Sherwin-Williams Company) is in a choppy range state on the monthly chart with 62% confidence. Monthly selloff back into the $310-$300 area after repeated failures to hold above the $340-$360 band; momentum cools (RSI ~46) while price sits near rising intermediate MAs.
On the monthly timeframe, SHW has key support at $300 and key resistance at $340. The most likely scenario (bullish) targets $340 and $360, with a revert level at $320.
SHW (The Sherwin-Williams Company) is currently classified as choppy range on the monthly chart, with 62% confidence. Confirmation requires: Two monthly closes holding above $340 (reclaim of EMA20 zone) would confirm a breakout attempt from the range. This would be invalidated by: A monthly close below $300 would invalidate the range thesis and tilt to a renewed downtrend/knife risk toward the next supports.
The most likely scenario (bullish) targets $340 and $360, with a revert level at $320. The alternative scenario (bearish) targets $275 and $250.
All content on this website — including charts, analysis, price targets, support/resistance levels, and position zones — is generated entirely by AI and provided for educational and informational purposes only.
This is not financial advice. NEXUSNOIR VENTURES SL (the operator of this website) is not a registered investment adviser or broker-dealer. You should not make investment decisions based solely on this information. Always do your own research and consult a qualified financial advisor.
By continuing, you acknowledge that you have read and agree to our full disclaimer & terms of use and privacy policy.