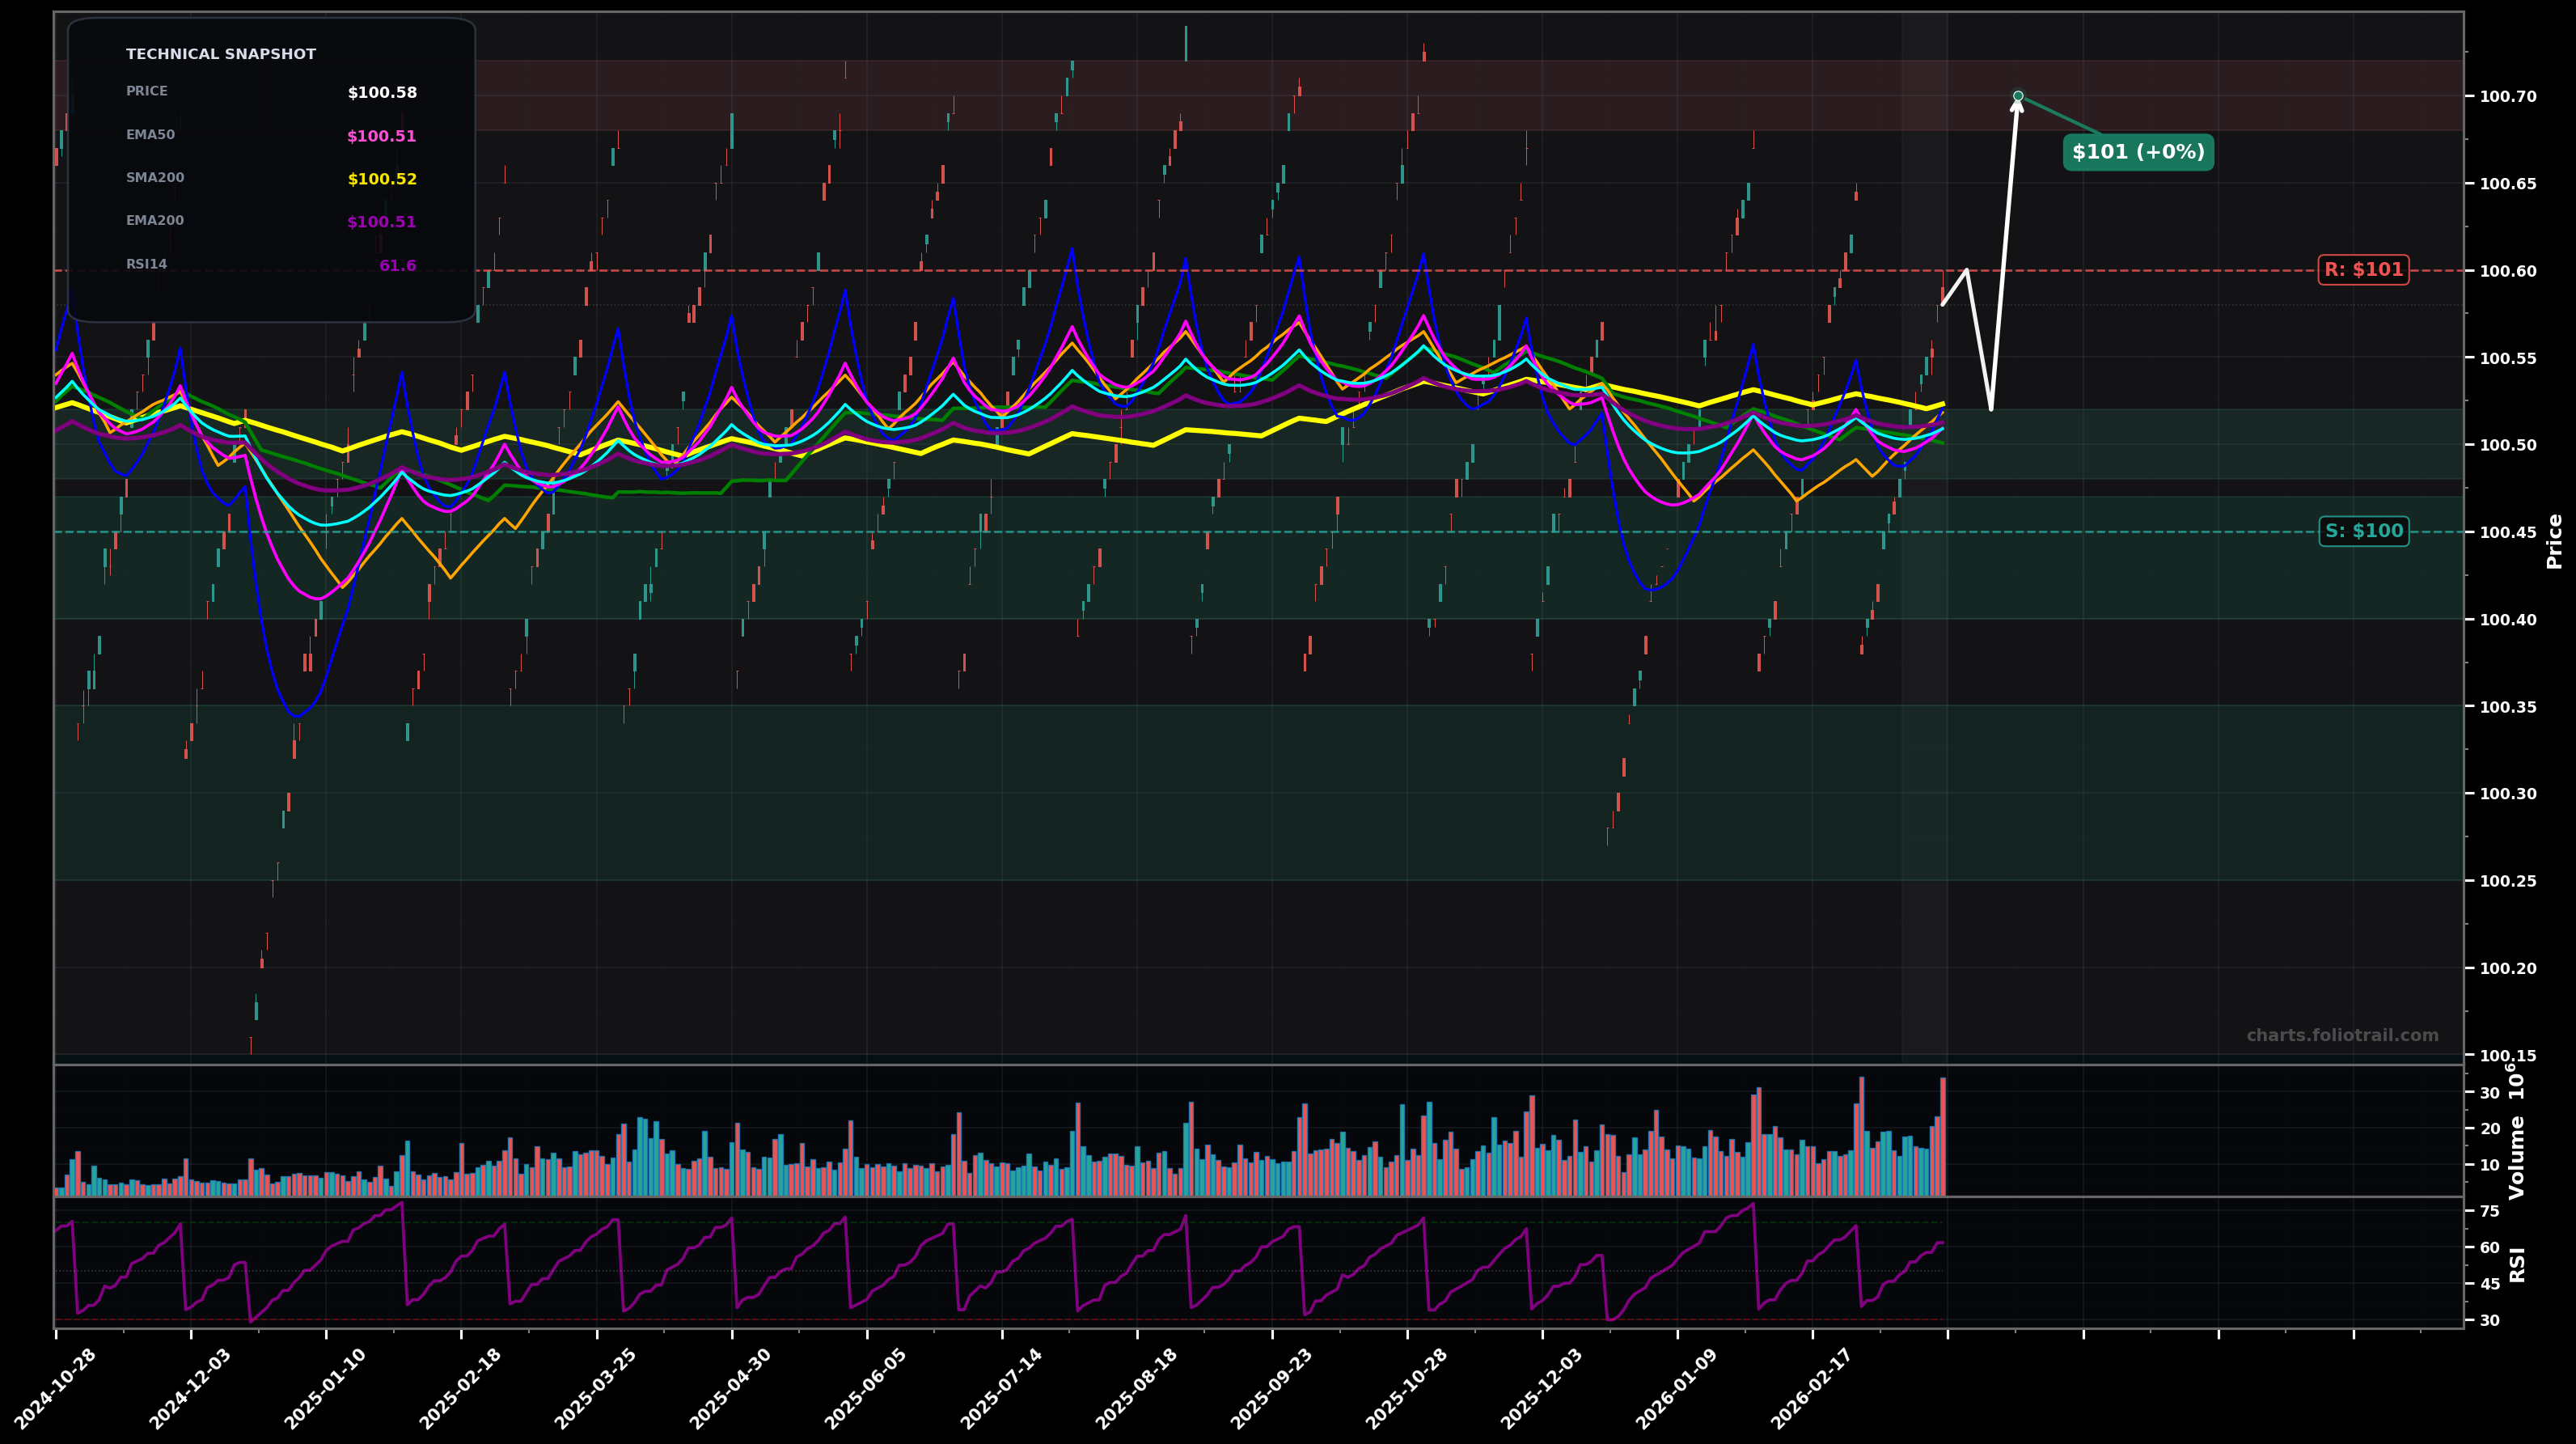
As of March 24, 2026, SGOV (iShares 0-3 Month Treasury Bond ETF) is in a stabilized base state on the daily chart, with a confidence level of 78%. Key support is at $100 and key resistance at $101. Price ~$100.58; tight sideways drift around a flat MA cluster (~$100.50-$100.52) with small step-like upticks; RSI ~62.
Range continuation: drift/hold above the MA cluster, with periodic small pops toward the upper band then mean-revert (typical cash-like behavior).
Minor breakdown/volatility blip: brief flush under the MA cluster to prior pivot support, then stabilize and snap back into the range.
2+ daily closes holding above $100.60
Daily close below $100.45
Start near the MA cluster (EMA50/100/200 + SMA50/100/200 ~ $100.50); add on a controlled dip to the lower range; heavy add only on a rare deeper deviation toward the lower pivot/volatility spike.
Trim into upper range extensions where price is stretched above the flat MA cluster; fully close only on an unusually large premium vs the long-term mean (rare for SGOV).
As of March 24, 2026, SGOV (iShares 0-3 Month Treasury Bond ETF) is in a stabilized base state on the daily chart with 78% confidence. Price ~$100.58; tight sideways drift around a flat MA cluster (~$100.50-$100.52) with small step-like upticks; RSI ~62.
On the daily timeframe, SGOV has key support at $100 and key resistance at $101. The most likely scenario (bullish) targets $101 and $101, with a revert level at $101.
SGOV (iShares 0-3 Month Treasury Bond ETF) is currently classified as stabilized base on the daily chart, with 78% confidence. Confirmation requires: 2+ daily closes holding above $100.60 This would be invalidated by: Daily close below $100.45
The most likely scenario (bullish) targets $101 and $101, with a revert level at $101. The alternative scenario (bearish) targets $100 and $100.
All content on this website — including charts, analysis, price targets, support/resistance levels, and position zones — is generated entirely by AI and provided for educational and informational purposes only.
This is not financial advice. NEXUSNOIR VENTURES SL (the operator of this website) is not a registered investment adviser or broker-dealer. You should not make investment decisions based solely on this information. Always do your own research and consult a qualified financial advisor.
By continuing, you acknowledge that you have read and agree to our full disclaimer & terms of use and privacy policy.