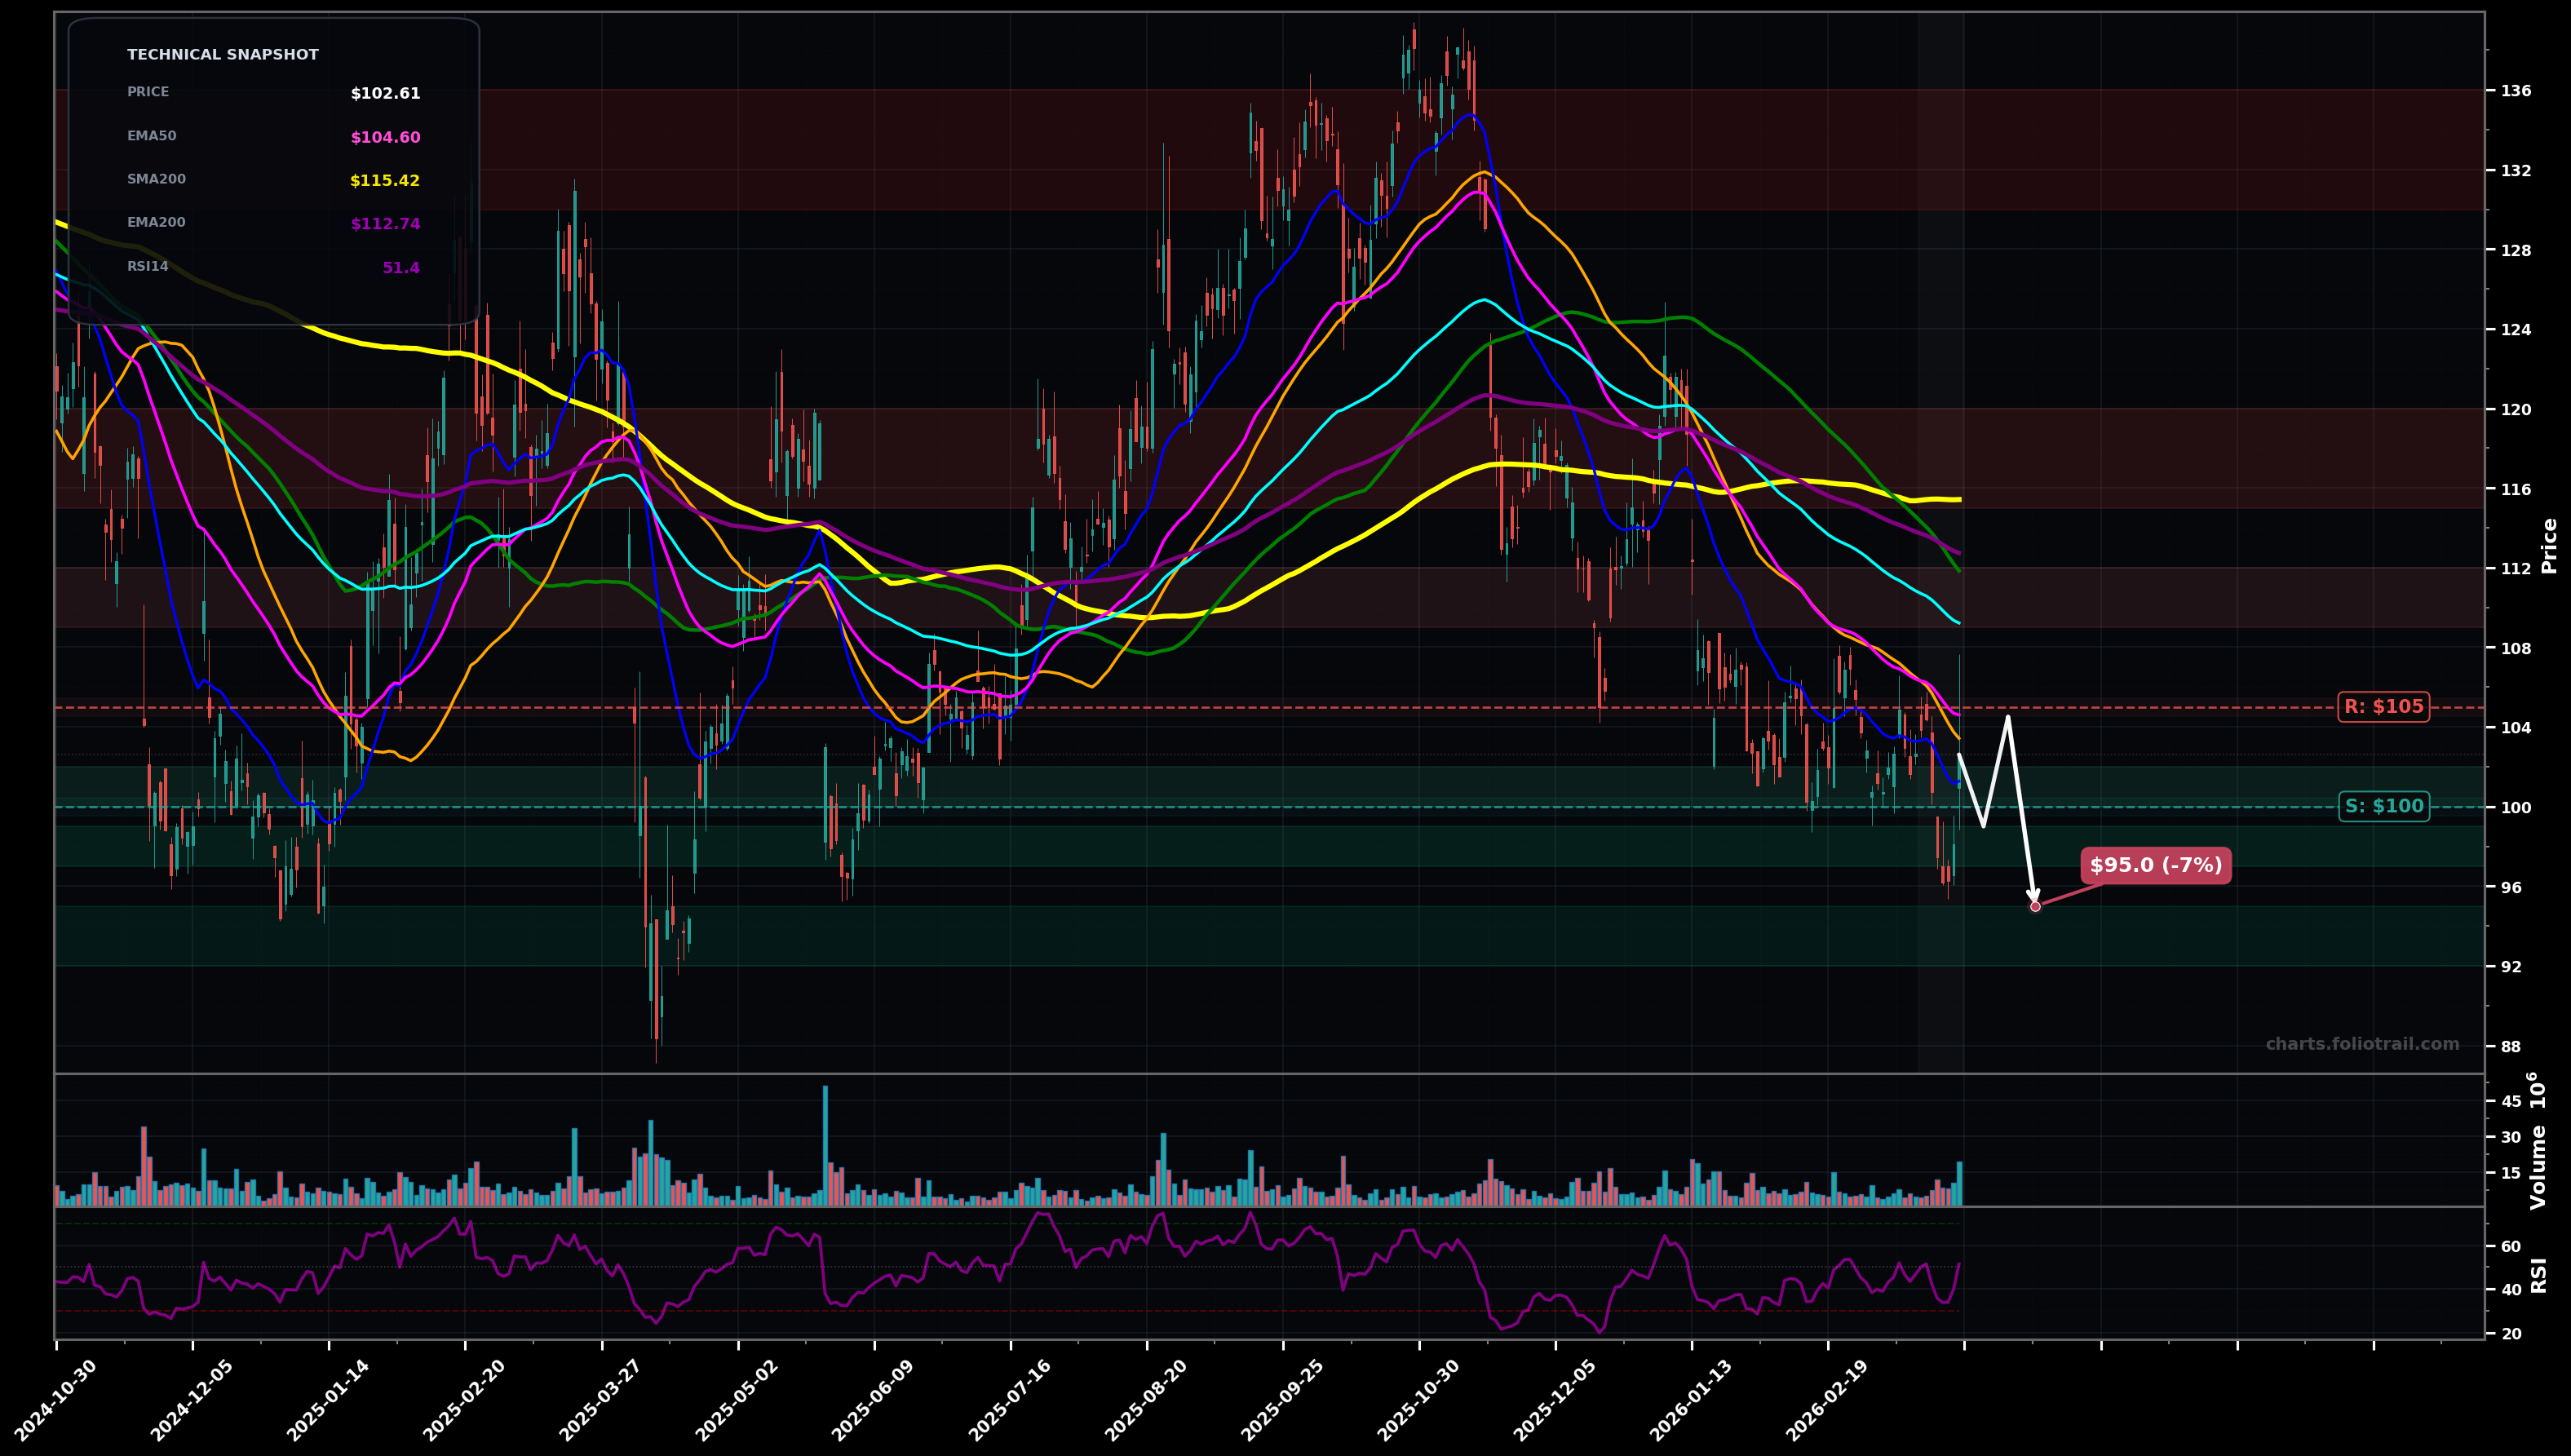
As of March 26, 2026, PDD (PDD Holdings Inc. American Depositary Shares) is in a downtrend state on the daily chart, with a confidence level of 72%. Key support is at $100 and key resistance at $105. Price at ~$102.61 broke down from a prior consolidation, trading below EMA50/EMA100 and below the $103-$105 band with weak bounces.
Bear continuation: failure to reclaim ~$105 leads to a retest/undercut of ~$100, then slide toward the next demand pocket; Elliott view = still in an impulsive leg down (wave 3/5 type) unless a clear higher low forms; Fib (approx from ~$136 to ~$100) implies $97-$95 as typical extension/next pocket.
Base + rebound: price holds ~$100 and forms a higher low, then mean-reverts into the overhead MA band; Elliott view = wave C/5 ending and starting an ABC corrective bounce; Fib retrace of the ~$136→~$100 drop targets ~38.2% near the low-$110s.
Daily close below $99.50 (break of the most recent swing-low area).
Two daily closes back above $105.50 (reclaim EMA50/SMA50 zone).
Scale near psychological/support pivot ~$100, add on confirmed breakdown/flush into Fib-extension demand ($97-$95), heavy add only if capitulation/overshoot toward prior base demand in low-$90s.
Trim into first major mean-reversion zone (EMA100/EMA200 + prior structure), trim more into the SMA200/supply band, close near prior swing-high supply where risk/reward skews unfavorable long-term.
As of March 26, 2026, PDD (PDD Holdings Inc. American Depositary Shares) is in a downtrend state on the daily chart with 72% confidence. Price at ~$102.61 broke down from a prior consolidation, trading below EMA50/EMA100 and below the $103-$105 band with weak bounces.
On the daily timeframe, PDD has key support at $100 and key resistance at $105. The most likely scenario (bearish) targets $99.0 and $95.0, with a revert level at $104.
PDD (PDD Holdings Inc. American Depositary Shares) is currently classified as downtrend on the daily chart, with 72% confidence. Confirmation requires: Daily close below $99.50 (break of the most recent swing-low area). This would be invalidated by: Two daily closes back above $105.50 (reclaim EMA50/SMA50 zone).
The most likely scenario (bearish) targets $99.0 and $95.0, with a revert level at $104. The alternative scenario (bullish) targets $109 and $115.
Multi-layer AI agents analyse 200+ stocks across daily, weekly, and monthly timeframes — producing market state classifications, price scenarios with targets, and position entry/exit levels. Updated every trading day after market close. No paywall. No sign-up required.
Built by Foliotrail.
All content on this website — including charts, analysis, price targets, support/resistance levels, and position zones — is generated entirely by AI and provided for educational and informational purposes only.
This is not financial advice. NEXUSNOIR VENTURES SL (the operator of this website) is not a registered investment adviser or broker-dealer. You should not make investment decisions based solely on this information. Always do your own research and consult a qualified financial advisor.
By continuing, you acknowledge that you have read and agree to our full disclaimer & terms of use and privacy policy.