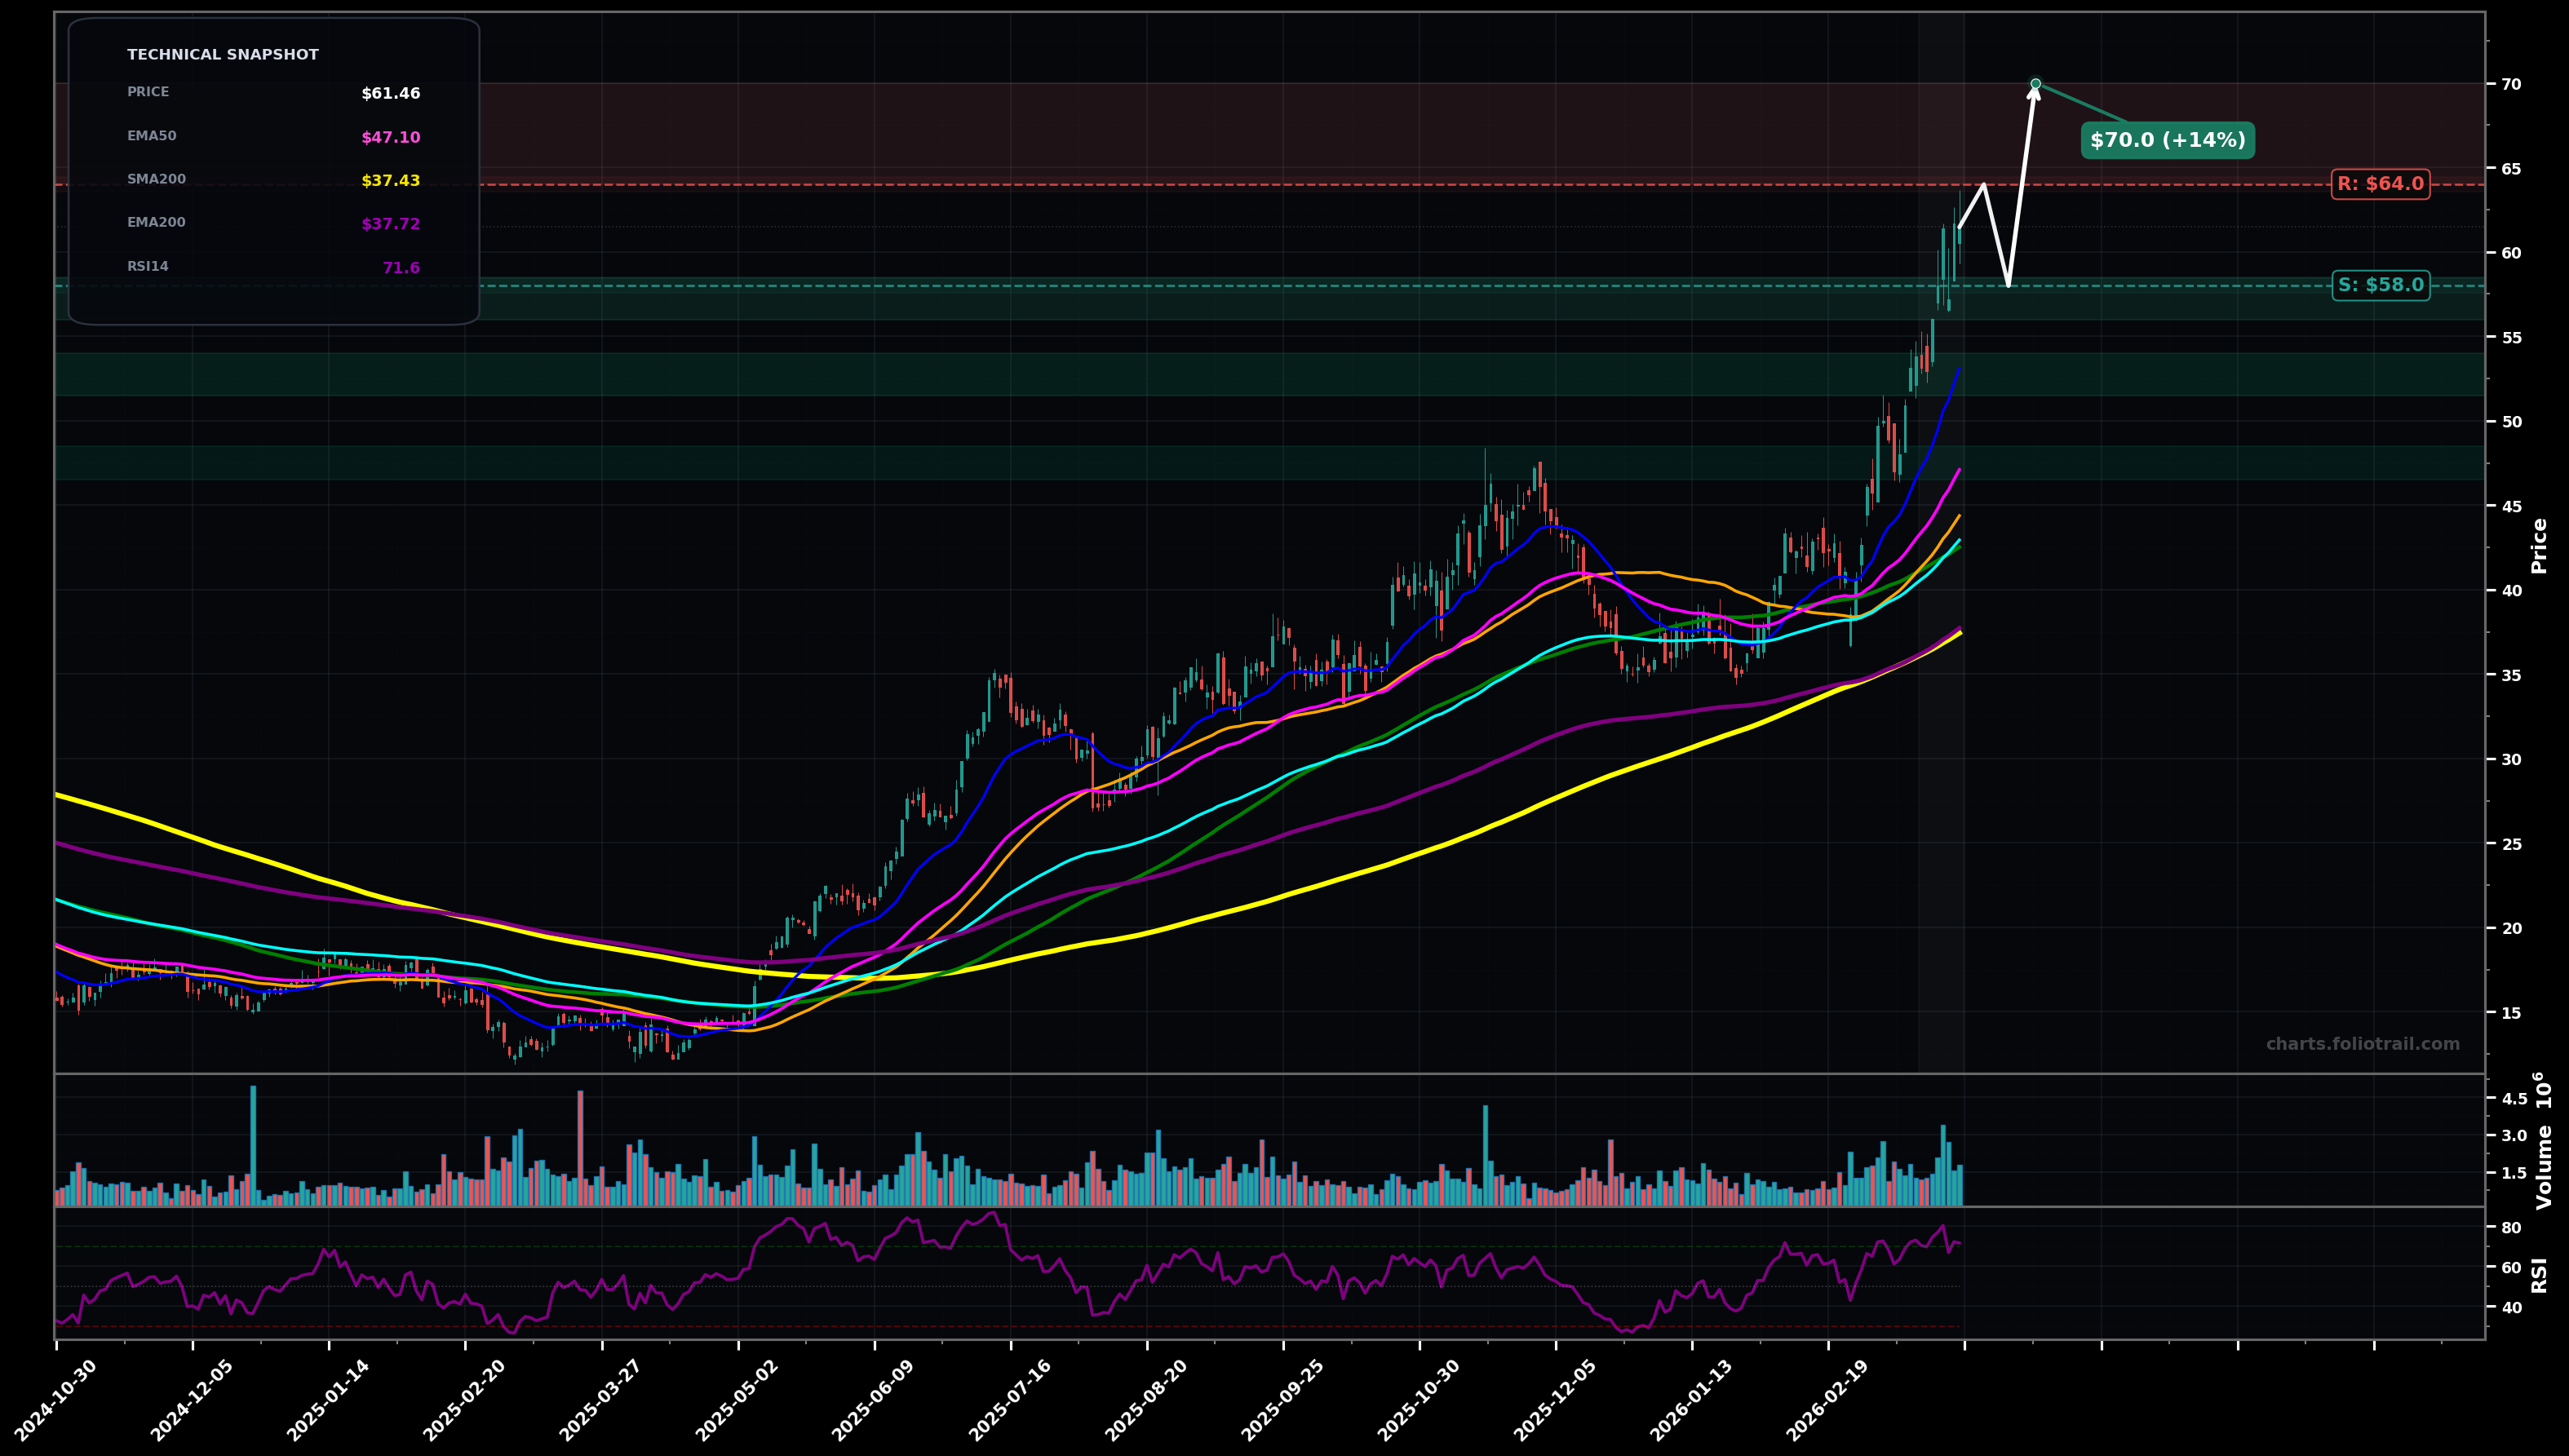
As of March 26, 2026, PARR (Par Pacific Holdings Inc.) is in a parabolic state on the daily chart, with a confidence level of 68%. Key support is at $58.0 and key resistance at $64.0. Strong HH/HL advance with a breakout to new highs; price extended above rising short/mid MAs, RSI elevated (~71).
Parabolic trend continues: brief consolidation/pullback into the breakout area, then push to a fresh high (Wave 3/5 extension behavior).
Mean reversion: sharper pullback as momentum cools (Wave 4-type correction) toward the rising EMA20/EMA50 zone before trend attempts to resume.
Daily close holding above $58.00 keeps the parabolic breakout intact
Daily close below $53.00 (loss of breakout base/fast MA zone) shifts to a deeper pullback/basing risk
Buy-the-dip framework: $56-$58 is prior breakout/retest support; $51-$54 aligns with EMA20/structure; $46-$48 is EMA50 confluence and likely deeper Wave-4/Fib retrace demand.
Trim into strength as price stretches further above EMA50/EMA100 with RSI already elevated; scale more aggressively if extension continues into likely Fib projection zones beyond the breakout.
As of March 26, 2026, PARR (Par Pacific Holdings Inc.) is in a parabolic state on the daily chart with 68% confidence. Strong HH/HL advance with a breakout to new highs; price extended above rising short/mid MAs, RSI elevated (~71).
On the daily timeframe, PARR has key support at $58.0 and key resistance at $64.0. The most likely scenario (bullish) targets $64.0 and $70.0, with a revert level at $58.0.
PARR (Par Pacific Holdings Inc.) is currently classified as parabolic on the daily chart, with 68% confidence. Confirmation requires: Daily close holding above $58.00 keeps the parabolic breakout intact This would be invalidated by: Daily close below $53.00 (loss of breakout base/fast MA zone) shifts to a deeper pullback/basing risk
The most likely scenario (bullish) targets $64.0 and $70.0, with a revert level at $58.0. The alternative scenario (bearish) targets $53.0 and $47.0.
Multi-layer AI agents analyse 200+ stocks across daily, weekly, and monthly timeframes — producing market state classifications, price scenarios with targets, and position entry/exit levels. Updated every trading day after market close. No paywall. No sign-up required.
Built by Foliotrail.
All content on this website — including charts, analysis, price targets, support/resistance levels, and position zones — is generated entirely by AI and provided for educational and informational purposes only.
This is not financial advice. NEXUSNOIR VENTURES SL (the operator of this website) is not a registered investment adviser or broker-dealer. You should not make investment decisions based solely on this information. Always do your own research and consult a qualified financial advisor.
By continuing, you acknowledge that you have read and agree to our full disclaimer & terms of use and privacy policy.