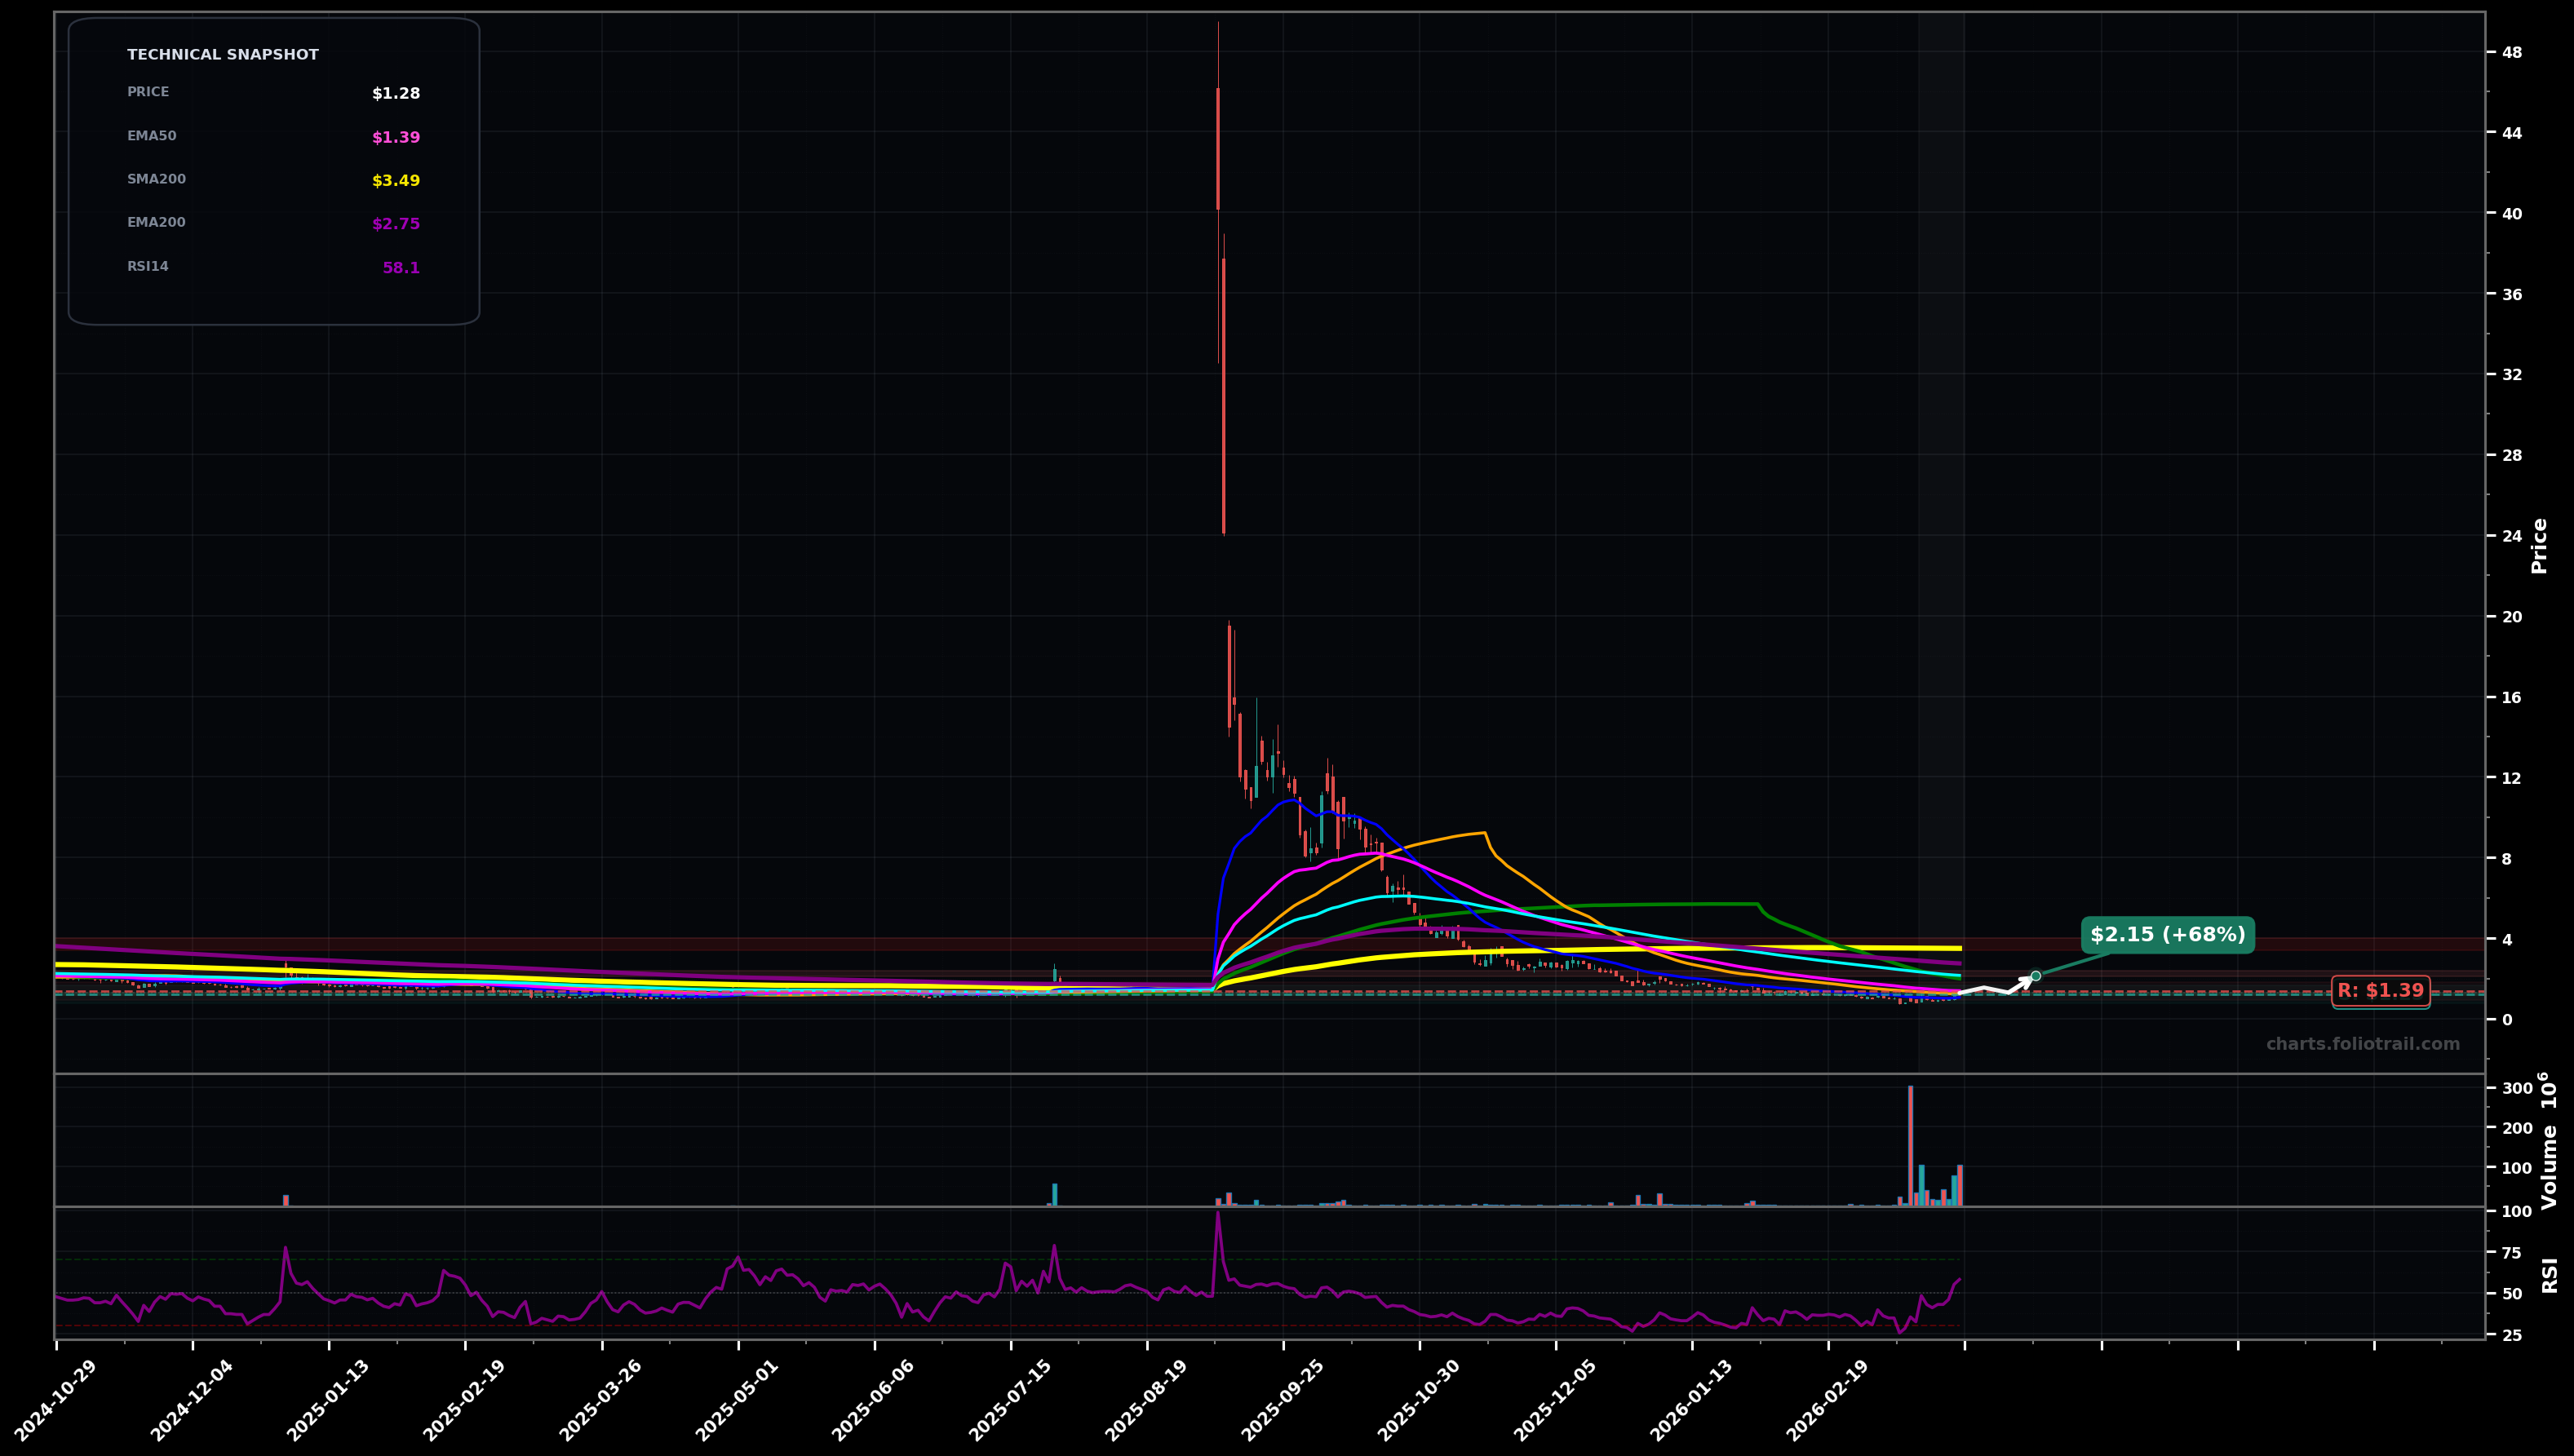
As of March 26, 2026, ORBS (Eightco Holdings Inc.) is in a bottoming attempt state on the daily chart, with a confidence level of 58%. Key support is at $1.23 and key resistance at $1.39. Price is ~$1.28, bouncing from a recent swing low with RSI ~58; still trading below EMA50/EMA100/EMA200 and below SMA100/SMA200, while holding just above SMA50.
Mean-reversion bounce continues as an early Wave (A)/(1) off the swing low; price retests EMA50 then pushes into the prior breakdown area. Expect a pullback (Wave (2)/B) to retest support before attempting the next leg higher.
Bear trend reasserts: bounce fails at EMA50 and rolls over into a final flush (Wave (5) extension) toward/through the swing low; any breakdown could accelerate given overhead MA supply.
Daily closes reclaim and hold above EMA50 (~$1.39) for 2+ sessions, then break $1.55.
Lose the recent swing low and close below $1.15.
Scale-in around SMA50/$1.23 and the current pivot area; add on a higher-low attempt near $1.05-$1.15, and reserve heavy adds for a capitulation/undercut into $1.00± where risk/reward improves if a reversal wick appears.
Trim into major overhead moving-average supply (EMA100 ~$2.15, EMA200 ~$2.75, SMA200 ~$3.49) where prior holders likely sell; full exit into the $3.4-$4.0 zone if reached as it aligns with long-term MA resistance and a typical larger-wave retracement ceiling.
As of March 26, 2026, ORBS (Eightco Holdings Inc.) is in a bottoming attempt state on the daily chart with 58% confidence. Price is ~$1.28, bouncing from a recent swing low with RSI ~58; still trading below EMA50/EMA100/EMA200 and below SMA100/SMA200, while holding just above SMA50.
On the daily timeframe, ORBS has key support at $1.23 and key resistance at $1.39. The most likely scenario (bullish) targets $1.55 and $2.15, with a revert level at $1.30.
ORBS (Eightco Holdings Inc.) is currently classified as bottoming attempt on the daily chart, with 58% confidence. Confirmation requires: Daily closes reclaim and hold above EMA50 (~$1.39) for 2+ sessions, then break $1.55. This would be invalidated by: Lose the recent swing low and close below $1.15.
The most likely scenario (bullish) targets $1.55 and $2.15, with a revert level at $1.30. The alternative scenario (bearish) targets $1.15 and $0.95.
Multi-layer AI agents analyse 200+ stocks across daily, weekly, and monthly timeframes — producing market state classifications, price scenarios with targets, and position entry/exit levels. Updated every trading day after market close. No paywall. No sign-up required.
Built by Foliotrail.
All content on this website — including charts, analysis, price targets, support/resistance levels, and position zones — is generated entirely by AI and provided for educational and informational purposes only.
This is not financial advice. NEXUSNOIR VENTURES SL (the operator of this website) is not a registered investment adviser or broker-dealer. You should not make investment decisions based solely on this information. Always do your own research and consult a qualified financial advisor.
By continuing, you acknowledge that you have read and agree to our full disclaimer & terms of use and privacy policy.