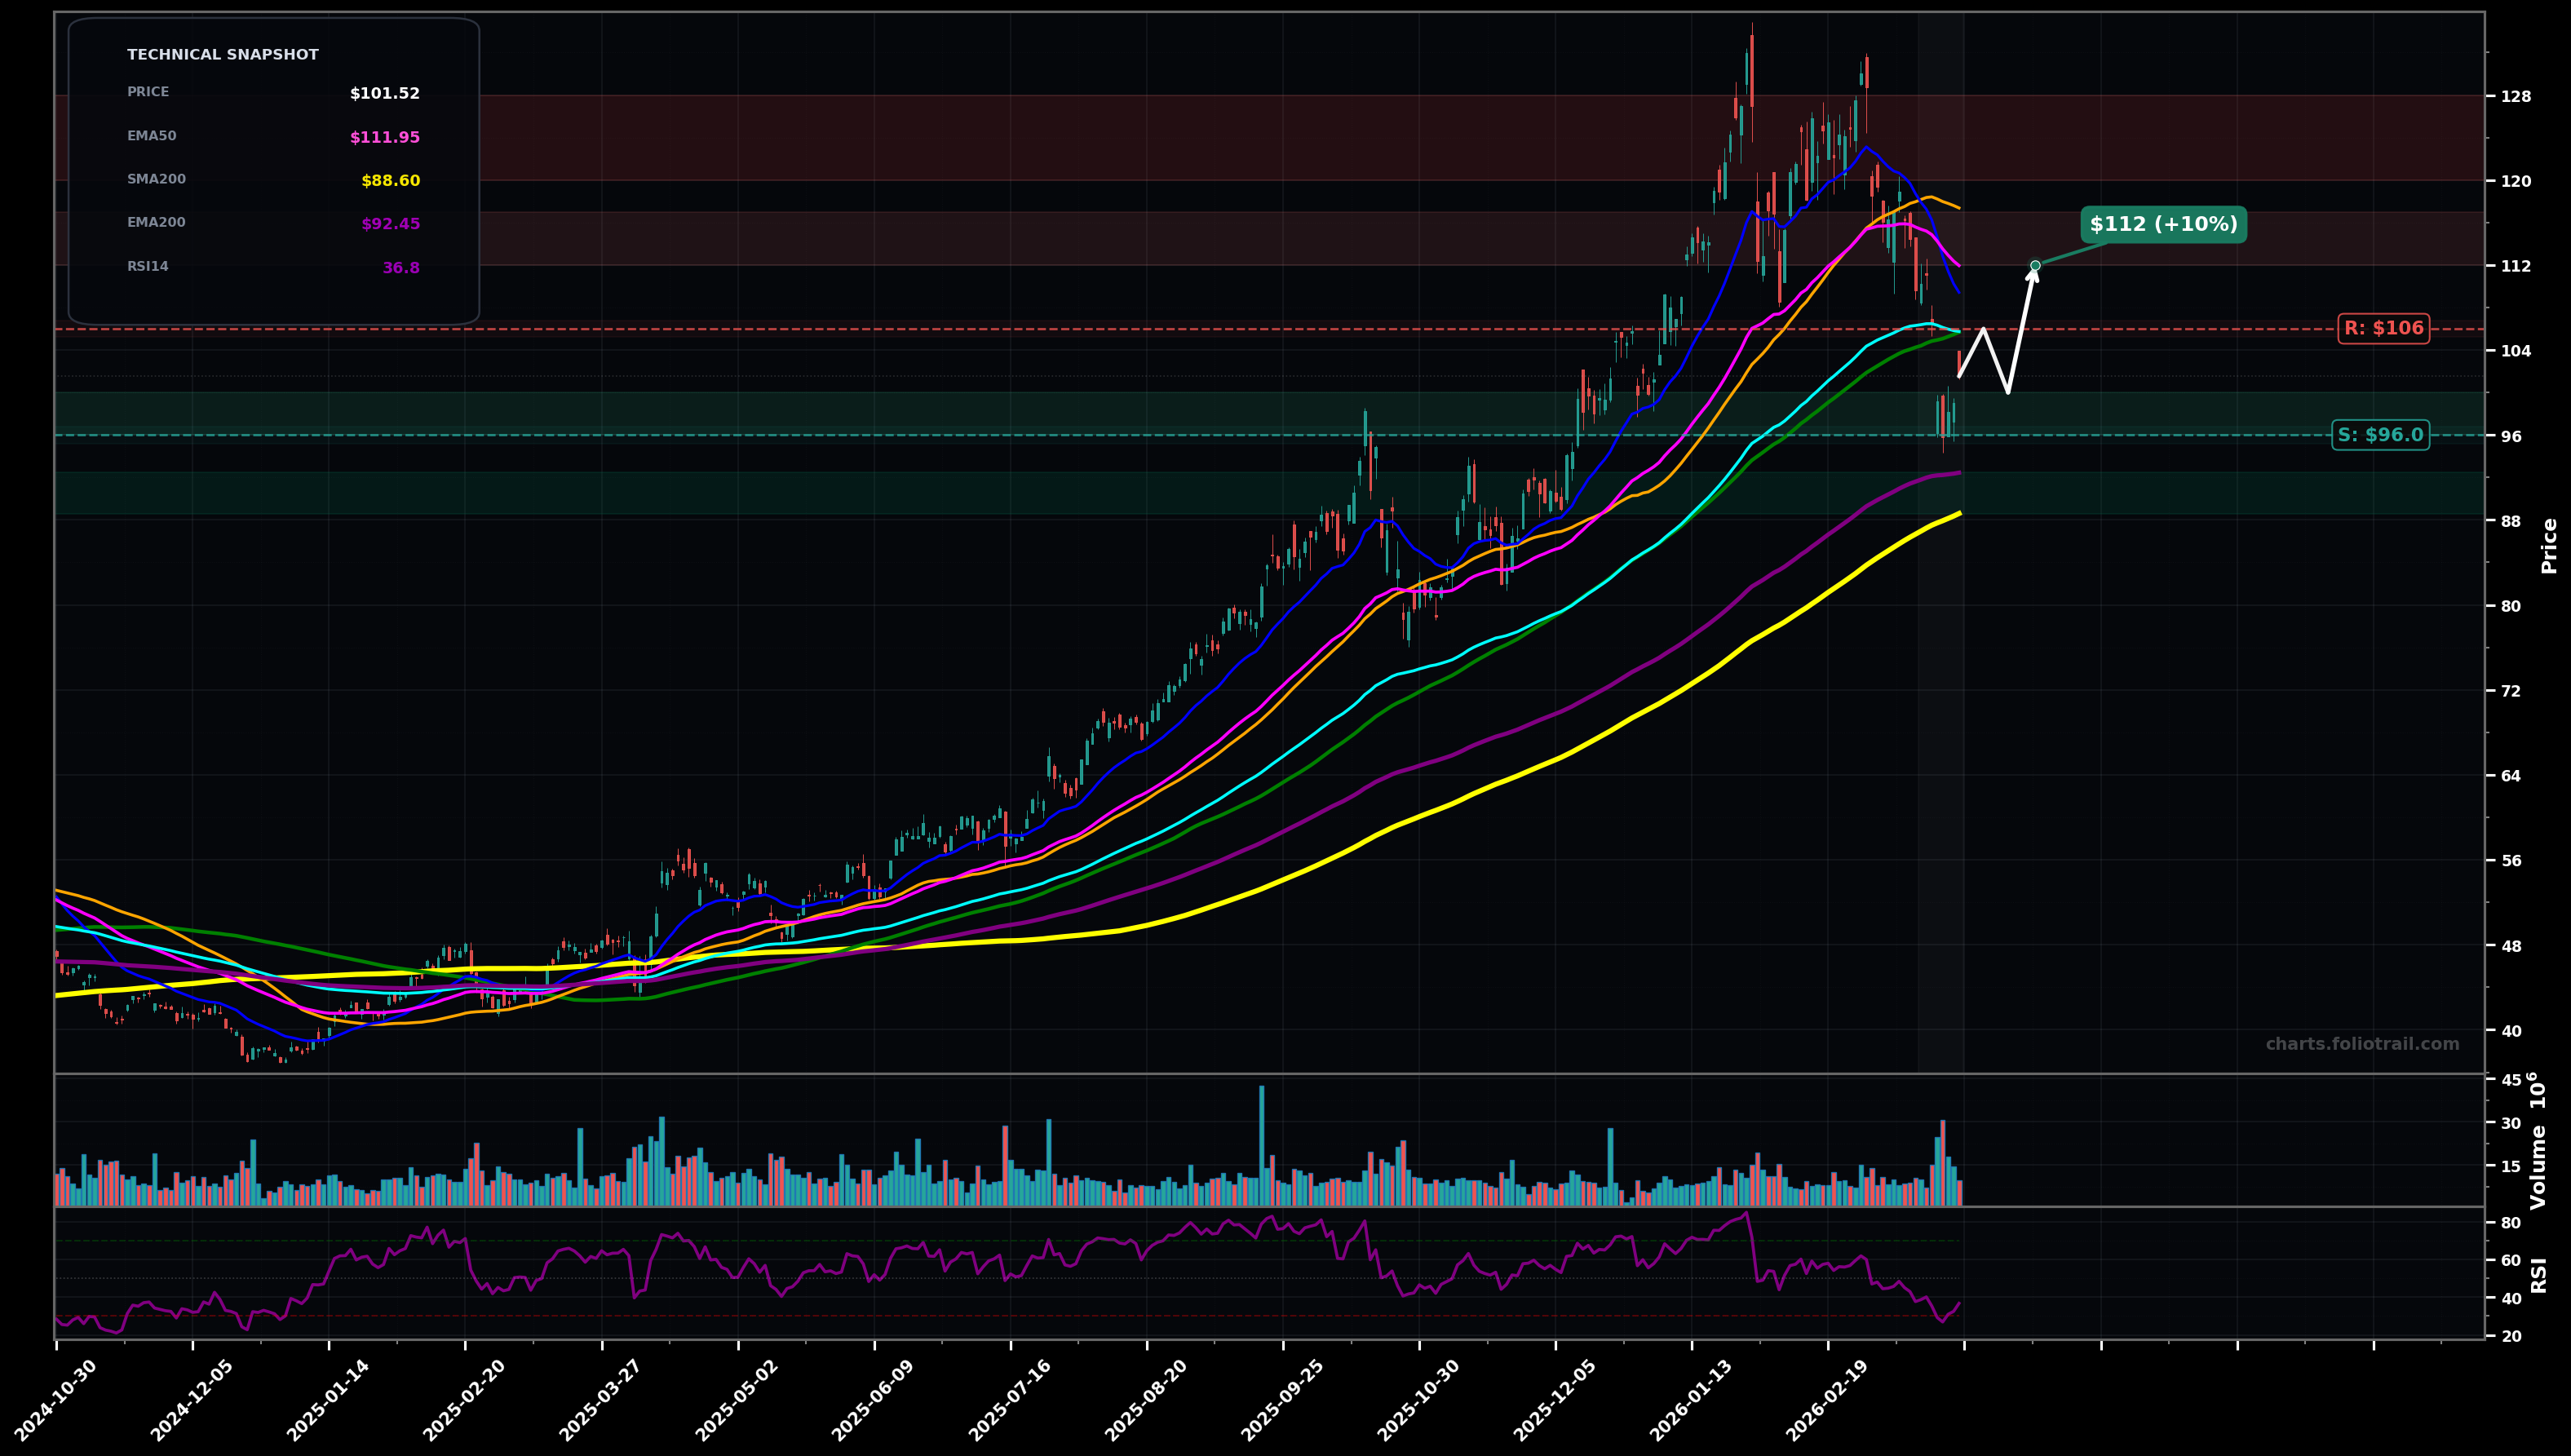
As of March 26, 2026, NEM (Newmont Corporation) is in a downtrend state on the daily chart, with a confidence level of 68%. Key support is at $96.0 and key resistance at $106. Sharp pullback from the $120s into the $100 area; price is below EMA50 ($111.95) and EMA100 ($105.74) but still above EMA200 ($92.45); RSI(14) ~36.8 suggests weak/near-oversold momentum.
Base-building between $96-$106 followed by a relief rally to retest the broken EMA100/EMA50 area; if accepted, push toward the prior breakdown zone near $112-$117.
Support fails and price retraces deeper toward the higher-timeframe trend support near EMA200/SMA200 region; likely a flush then bounce attempt.
Daily close below $96.00 (loss of the recent bounce base) would confirm continuation downside.
Two daily closes back above $112.00 (reclaim EMA50 zone) would invalidate the current downtrend bias.
Buy-the-dip zones are anchored to the $96 swing support, then EMA200 (~$92.45) and SMA200 (~$88.60) where prior trend buyers typically defend; aligns with a Fibonacci-style 0.5–0.618 retrace of the prior leg up.
Trim into reclaim/overhead-supply levels: first the EMA50/SMA50 area ($112-$117), then prior distribution highs ($120-$128); full exit if price becomes extended back above the prior peak zone ($128+), consistent with late-wave (Elliott wave 5) risk.
As of March 26, 2026, NEM (Newmont Corporation) is in a downtrend state on the daily chart with 68% confidence. Sharp pullback from the $120s into the $100 area; price is below EMA50 ($111.95) and EMA100 ($105.74) but still above EMA200 ($92.45); RSI(14) ~36.8 suggests weak/near-oversold momentum.
On the daily timeframe, NEM has key support at $96.0 and key resistance at $106. The most likely scenario (bullish) targets $106 and $112, with a revert level at $100.
NEM (Newmont Corporation) is currently classified as downtrend on the daily chart, with 68% confidence. Confirmation requires: Daily close below $96.00 (loss of the recent bounce base) would confirm continuation downside. This would be invalidated by: Two daily closes back above $112.00 (reclaim EMA50 zone) would invalidate the current downtrend bias.
The most likely scenario (bullish) targets $106 and $112, with a revert level at $100. The alternative scenario (bearish) targets $92.5 and $88.6.
Multi-layer AI agents analyse 200+ stocks across daily, weekly, and monthly timeframes — producing market state classifications, price scenarios with targets, and position entry/exit levels. Updated every trading day after market close. No paywall. No sign-up required.
Built by Foliotrail.
All content on this website — including charts, analysis, price targets, support/resistance levels, and position zones — is generated entirely by AI and provided for educational and informational purposes only.
This is not financial advice. NEXUSNOIR VENTURES SL (the operator of this website) is not a registered investment adviser or broker-dealer. You should not make investment decisions based solely on this information. Always do your own research and consult a qualified financial advisor.
By continuing, you acknowledge that you have read and agree to our full disclaimer & terms of use and privacy policy.