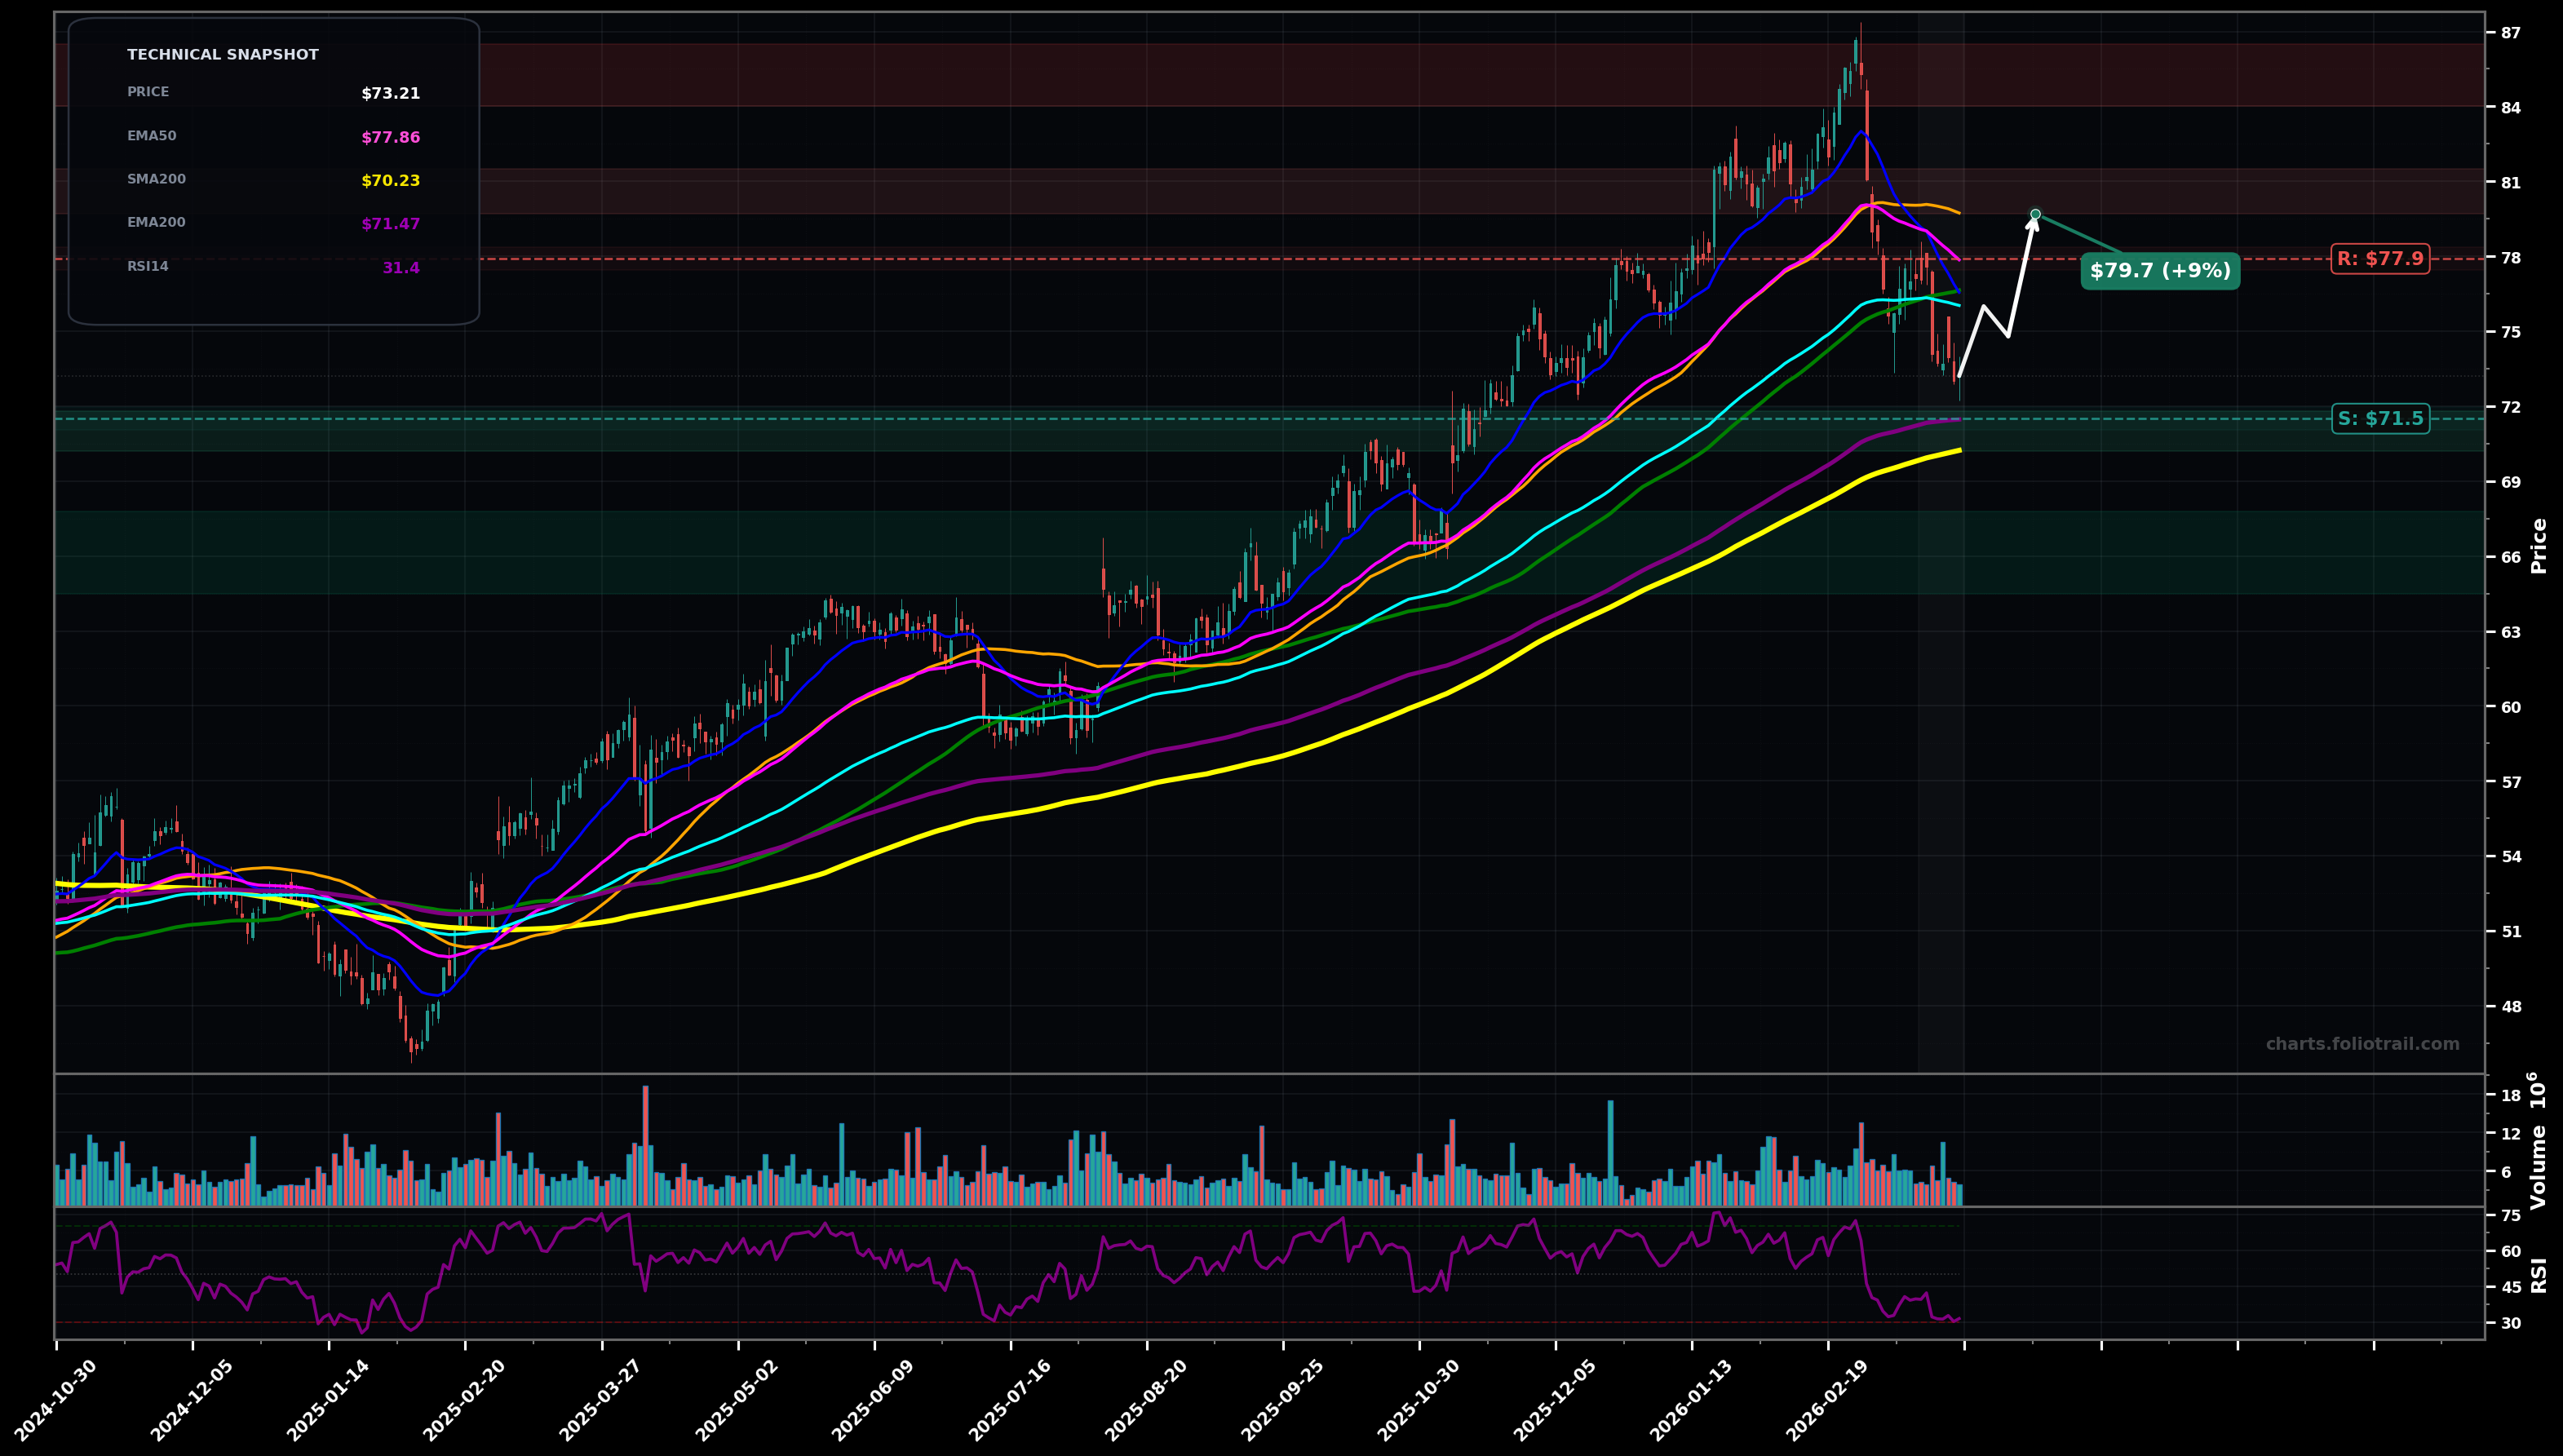
As of March 26, 2026, MNST (Monster Beverage Corporation) is in a downtrend state on the daily chart, with a confidence level of 67%. Key support is at $71.5 and key resistance at $77.9. Sharp pullback from ~$87 peak; price ~$73.21 under the short/mid MAs with RSI-14 ~31 (near-oversold), testing the rising long-term MA cluster.
Mean-reversion bounce develops from the $71.5–$70.2 support/MA confluence, then stalls at the broken EMA50/100 zone (bear-market rally within the pullback).
Support fails and the correction extends to the next demand band; price seeks the prior breakout zone and deeper fib retrace before any durable base forms.
Further downside acceptance with a daily close below ~$71.50 (EMA200 area) would confirm continued downtrend pressure
Two daily closes back above ~$77.90 (EMA50) would invalidate the immediate downtrend and shift to a reversal/base thesis
Buy interest tiers around EMA200/SMA200 confluence (~$71.5–$70.2) then prior structure/fib deeper retrace zones (~$68 and ~$66) if the downtrend extends.
Trim into overhead resistance (SMA50/EMA50 area then prior swing supply) and close into a full retest/extension above the prior ~$87 peak (likely late-wave/overextension).
As of March 26, 2026, MNST (Monster Beverage Corporation) is in a downtrend state on the daily chart with 67% confidence. Sharp pullback from ~$87 peak; price ~$73.21 under the short/mid MAs with RSI-14 ~31 (near-oversold), testing the rising long-term MA cluster.
On the daily timeframe, MNST has key support at $71.5 and key resistance at $77.9. The most likely scenario (bullish) targets $76.0 and $79.7, with a revert level at $74.8.
MNST (Monster Beverage Corporation) is currently classified as downtrend on the daily chart, with 67% confidence. Confirmation requires: Further downside acceptance with a daily close below ~$71.50 (EMA200 area) would confirm continued downtrend pressure This would be invalidated by: Two daily closes back above ~$77.90 (EMA50) would invalidate the immediate downtrend and shift to a reversal/base thesis
The most likely scenario (bullish) targets $76.0 and $79.7, with a revert level at $74.8. The alternative scenario (bearish) targets $70.2 and $66.0.
Multi-layer AI agents analyse 200+ stocks across daily, weekly, and monthly timeframes — producing market state classifications, price scenarios with targets, and position entry/exit levels. Updated every trading day after market close. No paywall. No sign-up required.
Built by Foliotrail.
All content on this website — including charts, analysis, price targets, support/resistance levels, and position zones — is generated entirely by AI and provided for educational and informational purposes only.
This is not financial advice. NEXUSNOIR VENTURES SL (the operator of this website) is not a registered investment adviser or broker-dealer. You should not make investment decisions based solely on this information. Always do your own research and consult a qualified financial advisor.
By continuing, you acknowledge that you have read and agree to our full disclaimer & terms of use and privacy policy.