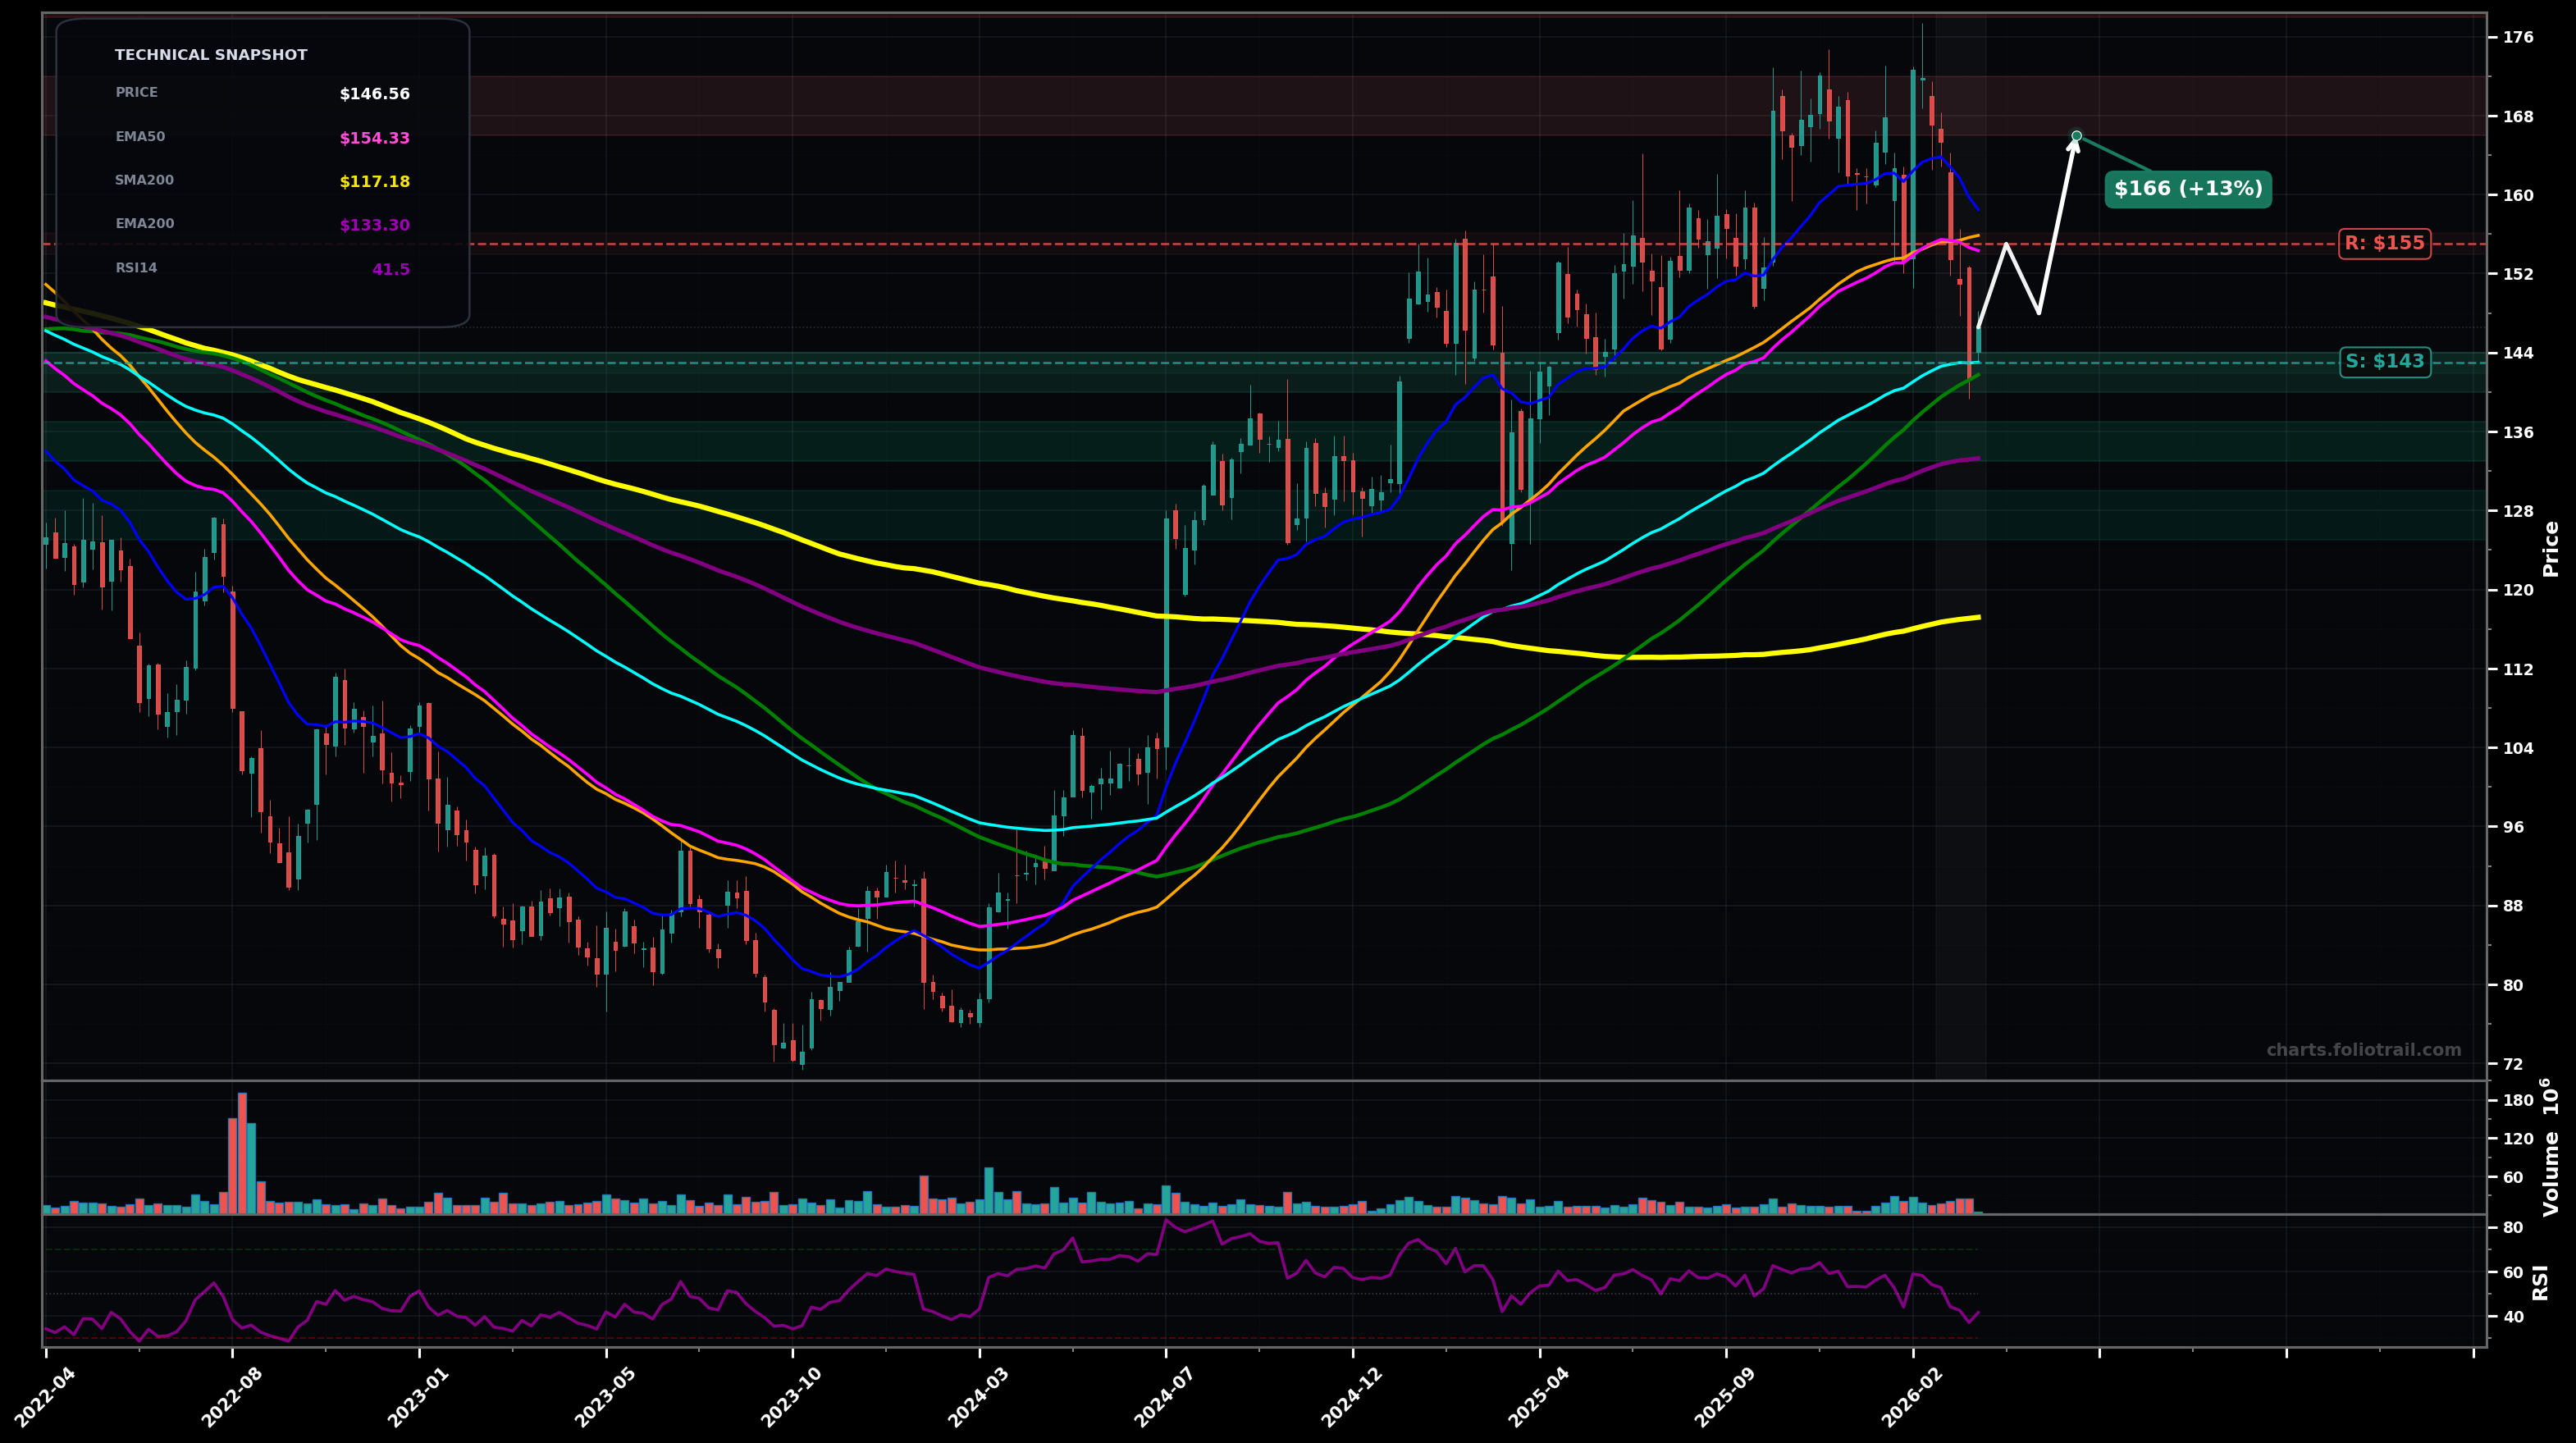
As of March 24, 2026, MMM (3M Company) is in a bottoming attempt state on the weekly chart, with a confidence level of 56%. Key support is at $143 and key resistance at $155. Sharp weekly selloff from the $165-$170 area, breaking below the rising EMA50 ($154.33) and SMA50 ($155.86); now sitting near the EMA100/SMA100 cluster ($143.02-$141.75) with RSI ~41 (weak momentum).
Mean-reversion bounce from the EMA100/SMA100 cluster ($141-$143), then chop and attempt to reclaim the broken EMA50/SMA50 ($154-$156); if reclaimed, price can work back toward the prior supply zone near $165.
Bearish continuation: failure to hold $141-$143 leads to a deeper Wave (C) style corrective leg toward EMA200 (~$133) and possibly a full retrace test near $125-$128 (prior consolidation zone).
Weekly close back above $155 (reclaim of EMA50/SMA50 zone) for 2+ weeks.
Weekly close below $133 (loss of EMA200 ~$133.36) would shift to DOWNTREND/FALLING_KNIFE risk.
Start at EMA100/SMA100 confluence support; add at EMA200 (key trend line in weekly); heavy add near deeper prior base/likely Fib retrace pocket if the correction extends.
Trim into prior swing-high supply ($166-$172); heavier trims if price breaks to fresh multi-year highs and stretches far above EMA50/100; close if a blow-off extension develops well beyond prior resistance.
As of March 24, 2026, MMM (3M Company) is in a bottoming attempt state on the weekly chart with 56% confidence. Sharp weekly selloff from the $165-$170 area, breaking below the rising EMA50 ($154.33) and SMA50 ($155.86); now sitting near the EMA100/SMA100 cluster ($143.02-$141.75) with RSI ~41 (weak momentum).
On the weekly timeframe, MMM has key support at $143 and key resistance at $155. The most likely scenario (bullish) targets $155 and $166, with a revert level at $148.
MMM (3M Company) is currently classified as bottoming attempt on the weekly chart, with 56% confidence. Confirmation requires: Weekly close back above $155 (reclaim of EMA50/SMA50 zone) for 2+ weeks. This would be invalidated by: Weekly close below $133 (loss of EMA200 ~$133.36) would shift to DOWNTREND/FALLING_KNIFE risk.
The most likely scenario (bullish) targets $155 and $166, with a revert level at $148. The alternative scenario (bearish) targets $133 and $126.
All content on this website — including charts, analysis, price targets, support/resistance levels, and position zones — is generated entirely by AI and provided for educational and informational purposes only.
This is not financial advice. NEXUSNOIR VENTURES SL (the operator of this website) is not a registered investment adviser or broker-dealer. You should not make investment decisions based solely on this information. Always do your own research and consult a qualified financial advisor.
By continuing, you acknowledge that you have read and agree to our full disclaimer & terms of use and privacy policy.