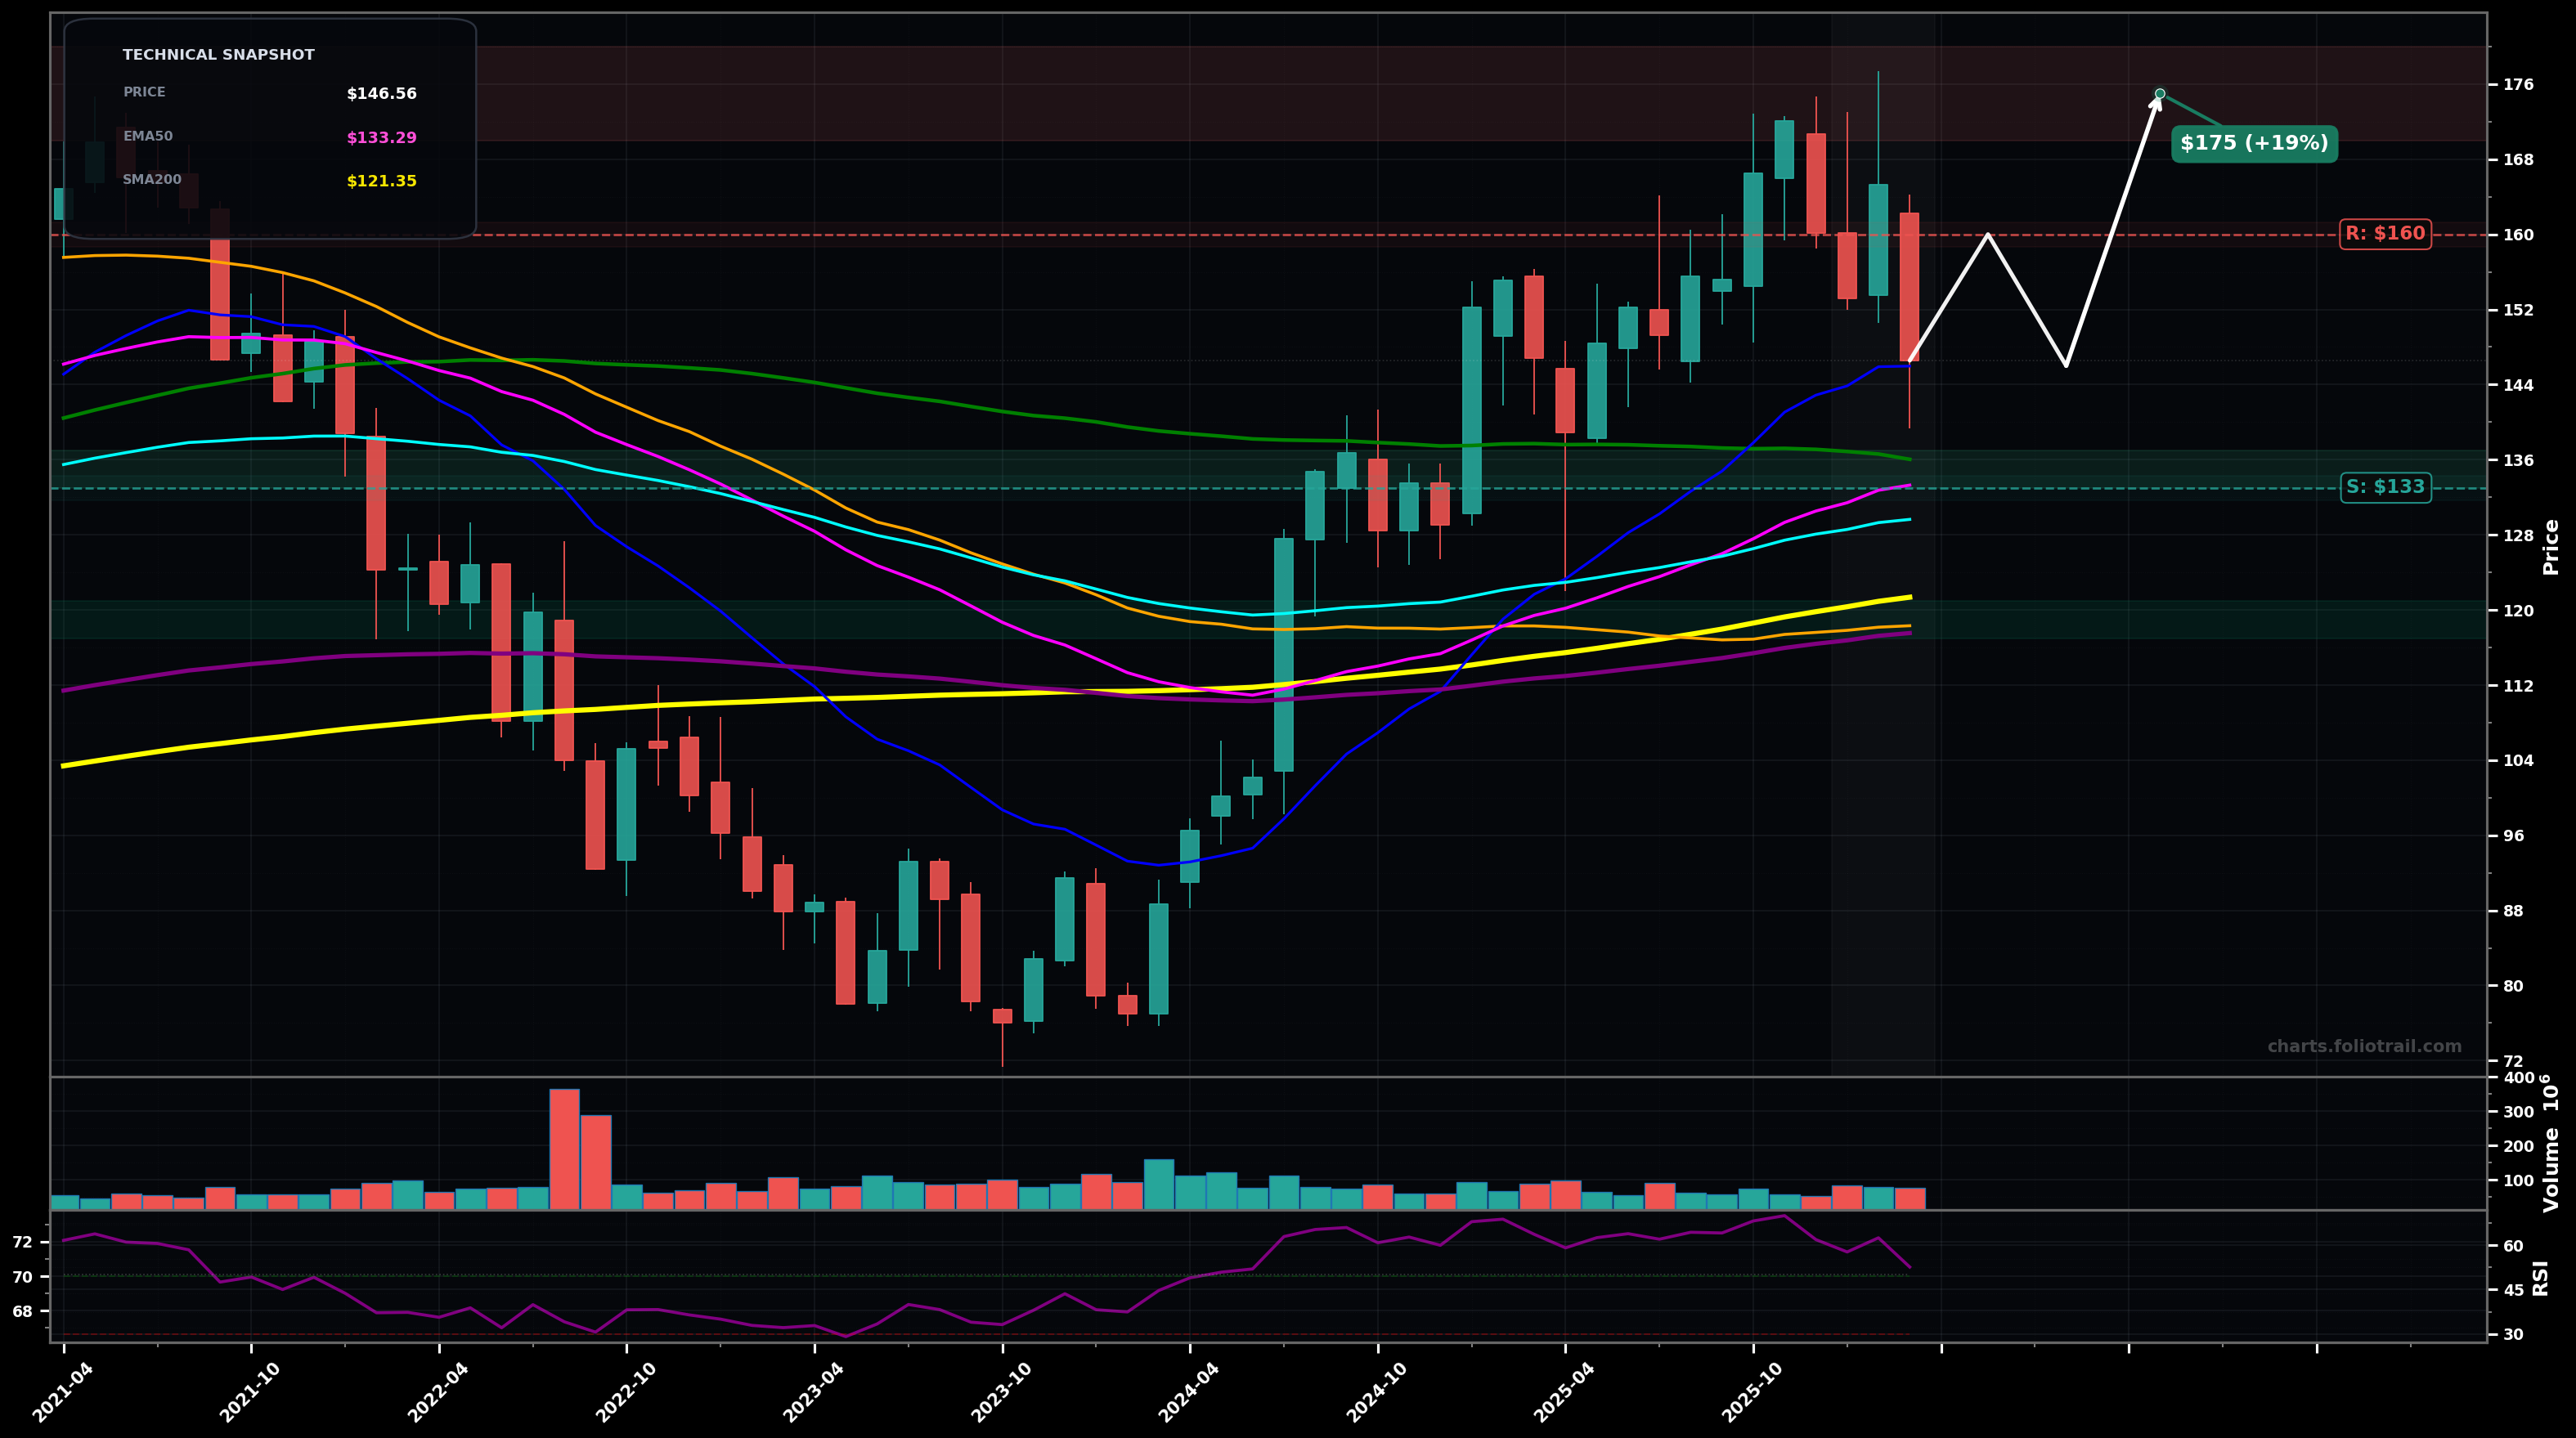
As of March 24, 2026, MMM (3M Company) is in a uptrend state on the monthly chart, with a confidence level of 67%. Key support is at $133 and key resistance at $160. Monthly uptrend stalled after a ~$175 swing high; last candles pulled back to ~$146.56 but price still holds above rising EMA50/EMA100 zone.
Bullish continuation: pullback holds above the EMA50/EMA100 cluster (~$133–$130), then price reclaims $160 and attempts a retest of the ~$175 swing high (Elliott: wave 4 pullback completing, then wave 5 push).
Bearish deeper correction: failure to reclaim $160 and a break below EMA50 (~$133) opens a mean-reversion move toward the next confluence around SMA100 (~$136) already lost as support on momentum, then down to the longer-term MA cluster/SMA200-EMA200 area (~$121–$118) (Fib: ~38.2% retrace of the $75->$175 advance sits near ~$137; ~50% near ~$125).
Monthly close back above $160 would confirm trend continuation toward prior highs
Monthly close below $133 would invalidate the uptrend and shift bias to a deeper correction
Start at EMA50/38.2% Fib confluence, add on 50% retrace + EMA100 loss, heavy add at SMA200/EMA200 cluster where long-term trend support typically defends.
Trim into prior swing-high supply ($175 area) and potential Fib extensions; progressively heavier trims if price becomes stretched well above the rising EMA50/EMA100 with momentum divergence risk.
As of March 24, 2026, MMM (3M Company) is in a uptrend state on the monthly chart with 67% confidence. Monthly uptrend stalled after a ~$175 swing high; last candles pulled back to ~$146.56 but price still holds above rising EMA50/EMA100 zone.
On the monthly timeframe, MMM has key support at $133 and key resistance at $160. The most likely scenario (bullish) targets $160 and $175, with a revert level at $146.
MMM (3M Company) is currently classified as uptrend on the monthly chart, with 67% confidence. Confirmation requires: Monthly close back above $160 would confirm trend continuation toward prior highs This would be invalidated by: Monthly close below $133 would invalidate the uptrend and shift bias to a deeper correction
The most likely scenario (bullish) targets $160 and $175, with a revert level at $146. The alternative scenario (bearish) targets $133 and $121.
All content on this website — including charts, analysis, price targets, support/resistance levels, and position zones — is generated entirely by AI and provided for educational and informational purposes only.
This is not financial advice. NEXUSNOIR VENTURES SL (the operator of this website) is not a registered investment adviser or broker-dealer. You should not make investment decisions based solely on this information. Always do your own research and consult a qualified financial advisor.
By continuing, you acknowledge that you have read and agree to our full disclaimer & terms of use and privacy policy.