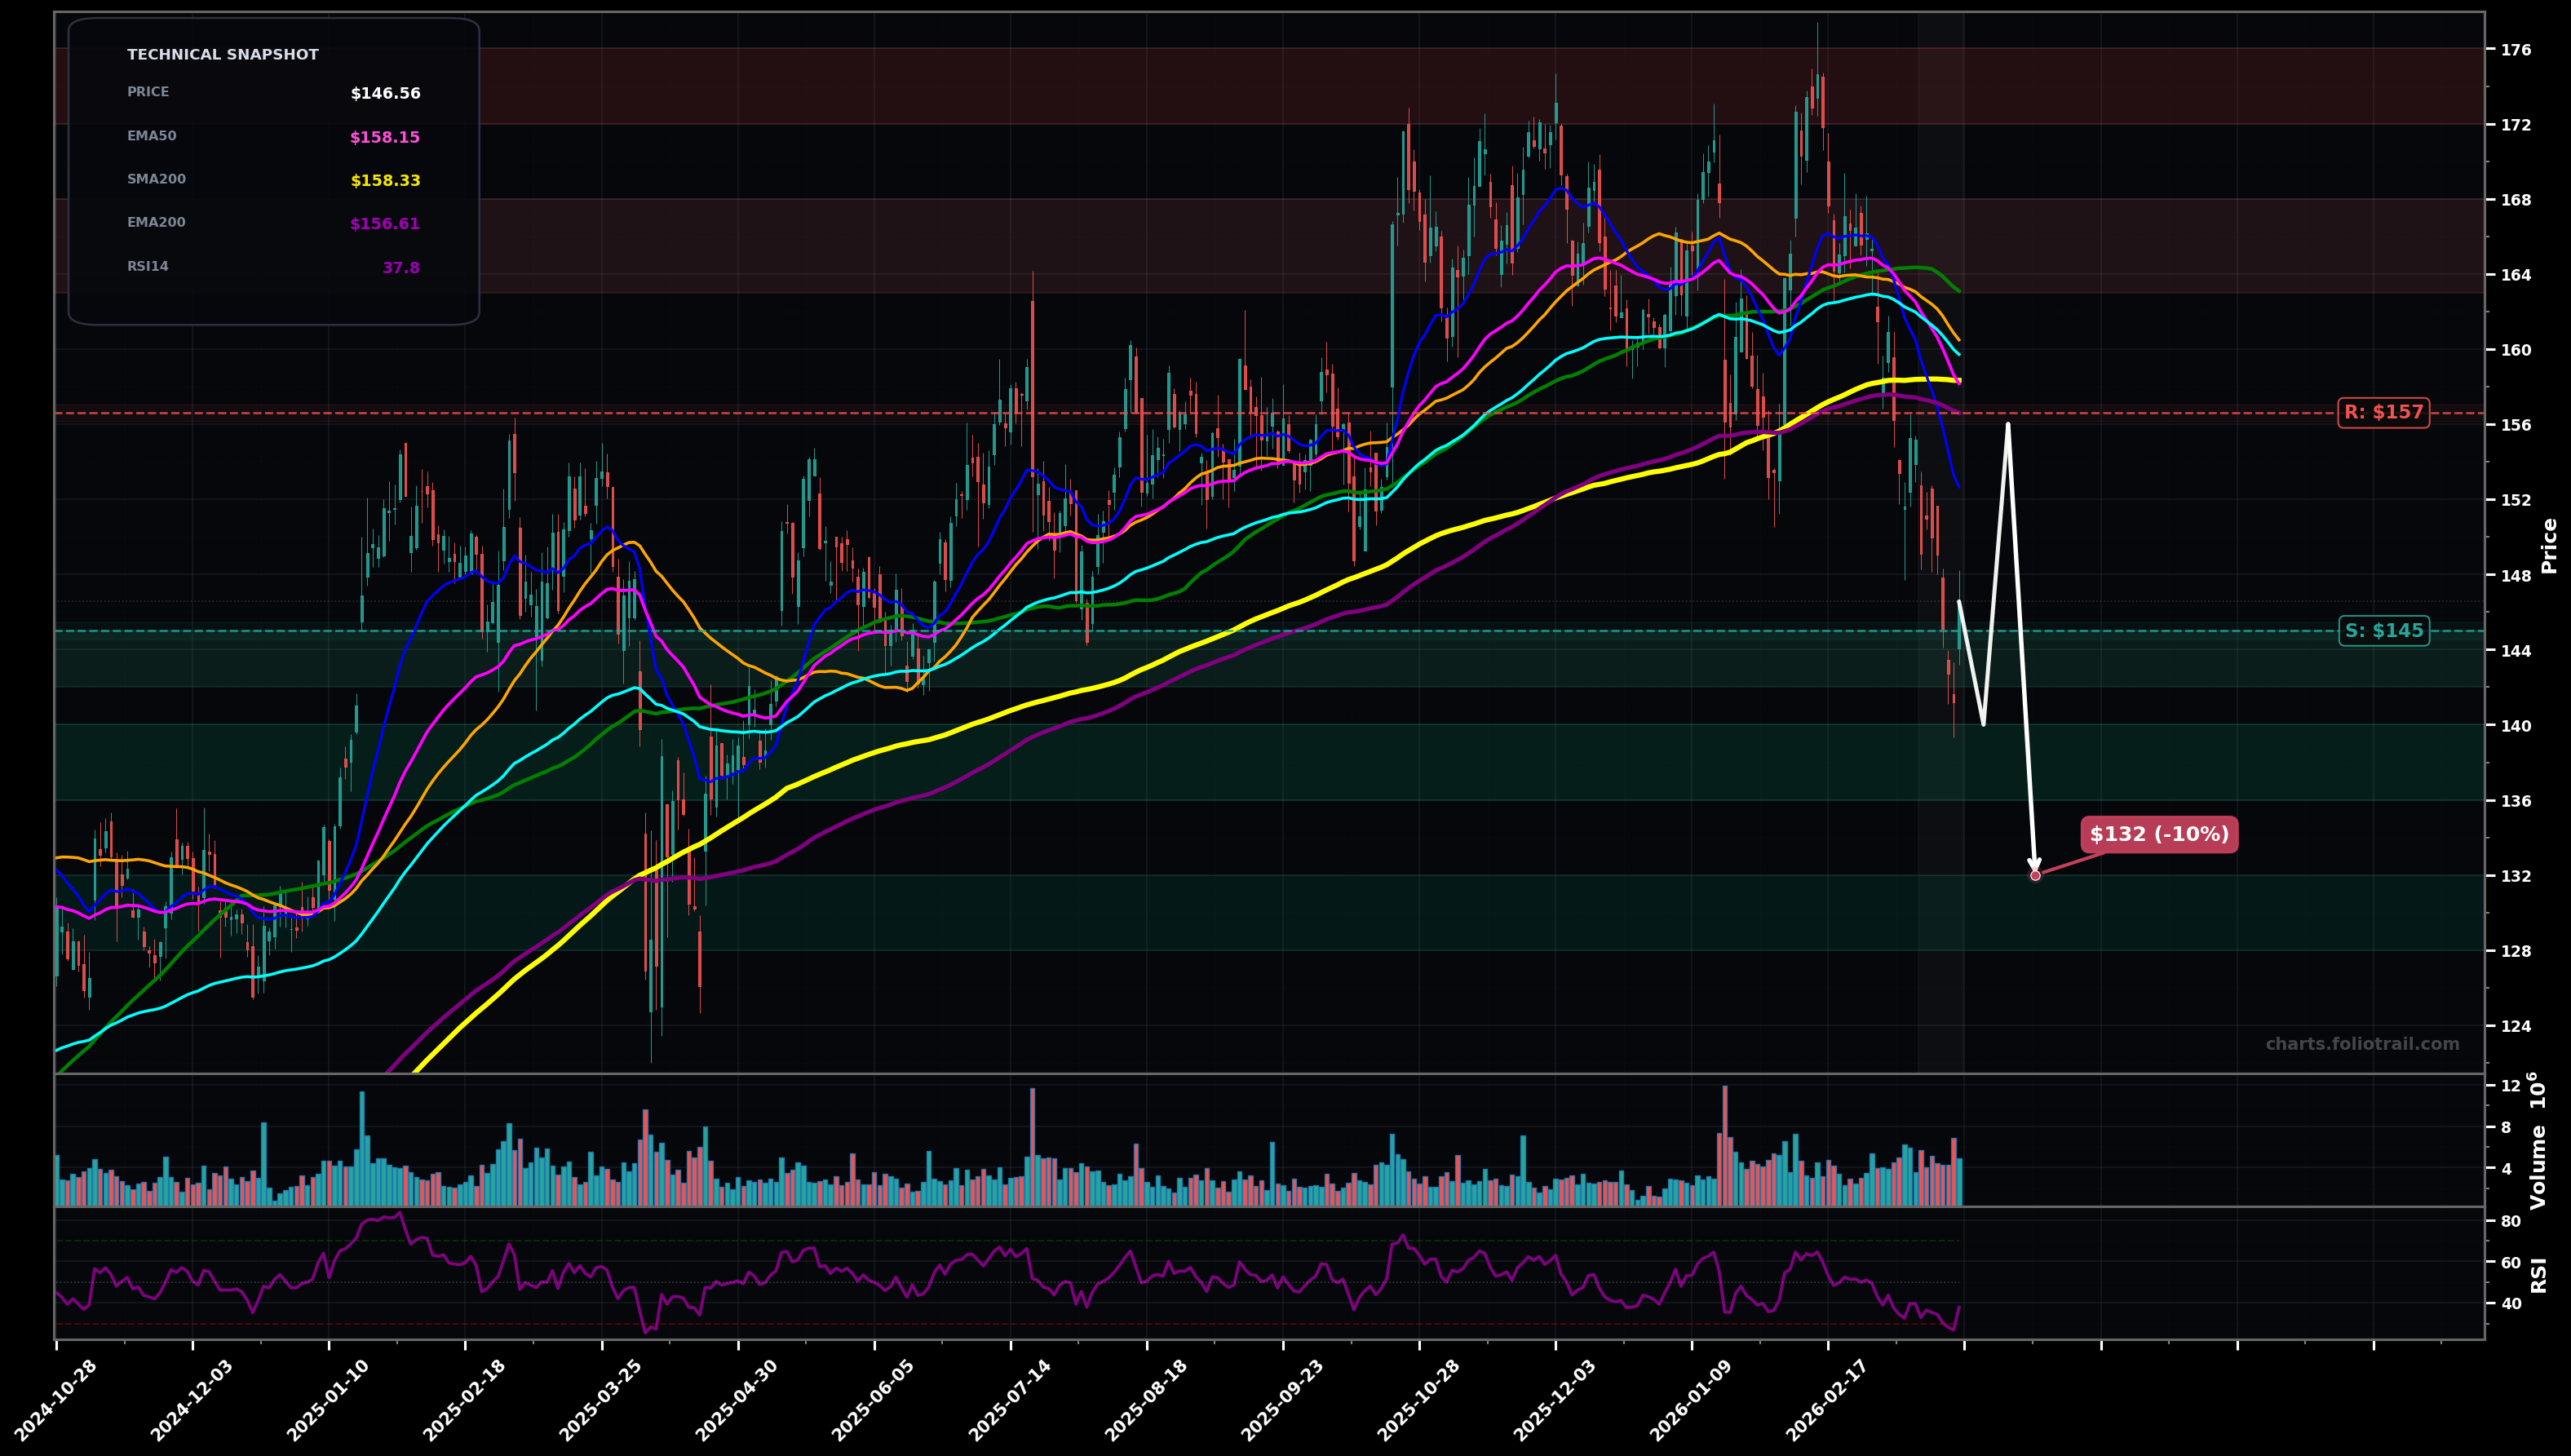
As of March 24, 2026, MMM (3M Company) is in a falling knife state on the daily chart, with a confidence level of 72%. Key support is at $145 and key resistance at $157. Sharp selloff from the $160s into the mid-$140s; price ($146.56) is below the clustered short/mid MAs (EMA50/100 and SMA50/100/200) with a weak bounce attempt; RSI ~37.8.
Bearish continuation: after a brief relief bounce, sellers defend the $156-$160 MA cluster and price retests/breaks the recent swing-low zone; Elliott view: this looks like an impulsive sell leg (wave 3/ C) with only a shallow wave-4 style rebound before another push down. Fib guide: retraces likely stall around 38.2%-50% of the last drop (~$154-$160).
Mean-reversion/base attempt: price holds above $145 and forms a higher low, then reclaims the $156-$160 band (EMA200/SMA200/EMA50 area) to transition into a stabilized base; Elliott view: current decline could be late wave 5 (or C) with a larger ABC rebound starting. Fib guide: first upside magnet is 50%-61.8% of the drop (~$160-$164).
Daily close below $145.00 followed by continuation toward $140.00
Two daily closes back above $158.15 (EMA50) while holding above $156.60 (EMA200)
Scale in at/under the current swing-low support ($145) with adds at the next demand shelf ($140) and heavy add only if capitulation tests prior base support ($132 area) while watching for a HL/MA reclaim.
Trim into resistance where prior supply and Fib retrace levels cluster (mid/high-$160s, then $170s); exit if price becomes extended back above the major MA stack and retests prior highs (stretch risk).
As of March 24, 2026, MMM (3M Company) is in a falling knife state on the daily chart with 72% confidence. Sharp selloff from the $160s into the mid-$140s; price ($146.56) is below the clustered short/mid MAs (EMA50/100 and SMA50/100/200) with a weak bounce attempt; RSI ~37.8.
On the daily timeframe, MMM has key support at $145 and key resistance at $157. The most likely scenario (bearish) targets $140 and $132, with a revert level at $156.
MMM (3M Company) is currently classified as falling knife on the daily chart, with 72% confidence. Confirmation requires: Daily close below $145.00 followed by continuation toward $140.00 This would be invalidated by: Two daily closes back above $158.15 (EMA50) while holding above $156.60 (EMA200)
The most likely scenario (bearish) targets $140 and $132, with a revert level at $156. The alternative scenario (bullish) targets $157 and $163.
All content on this website — including charts, analysis, price targets, support/resistance levels, and position zones — is generated entirely by AI and provided for educational and informational purposes only.
This is not financial advice. NEXUSNOIR VENTURES SL (the operator of this website) is not a registered investment adviser or broker-dealer. You should not make investment decisions based solely on this information. Always do your own research and consult a qualified financial advisor.
By continuing, you acknowledge that you have read and agree to our full disclaimer & terms of use and privacy policy.