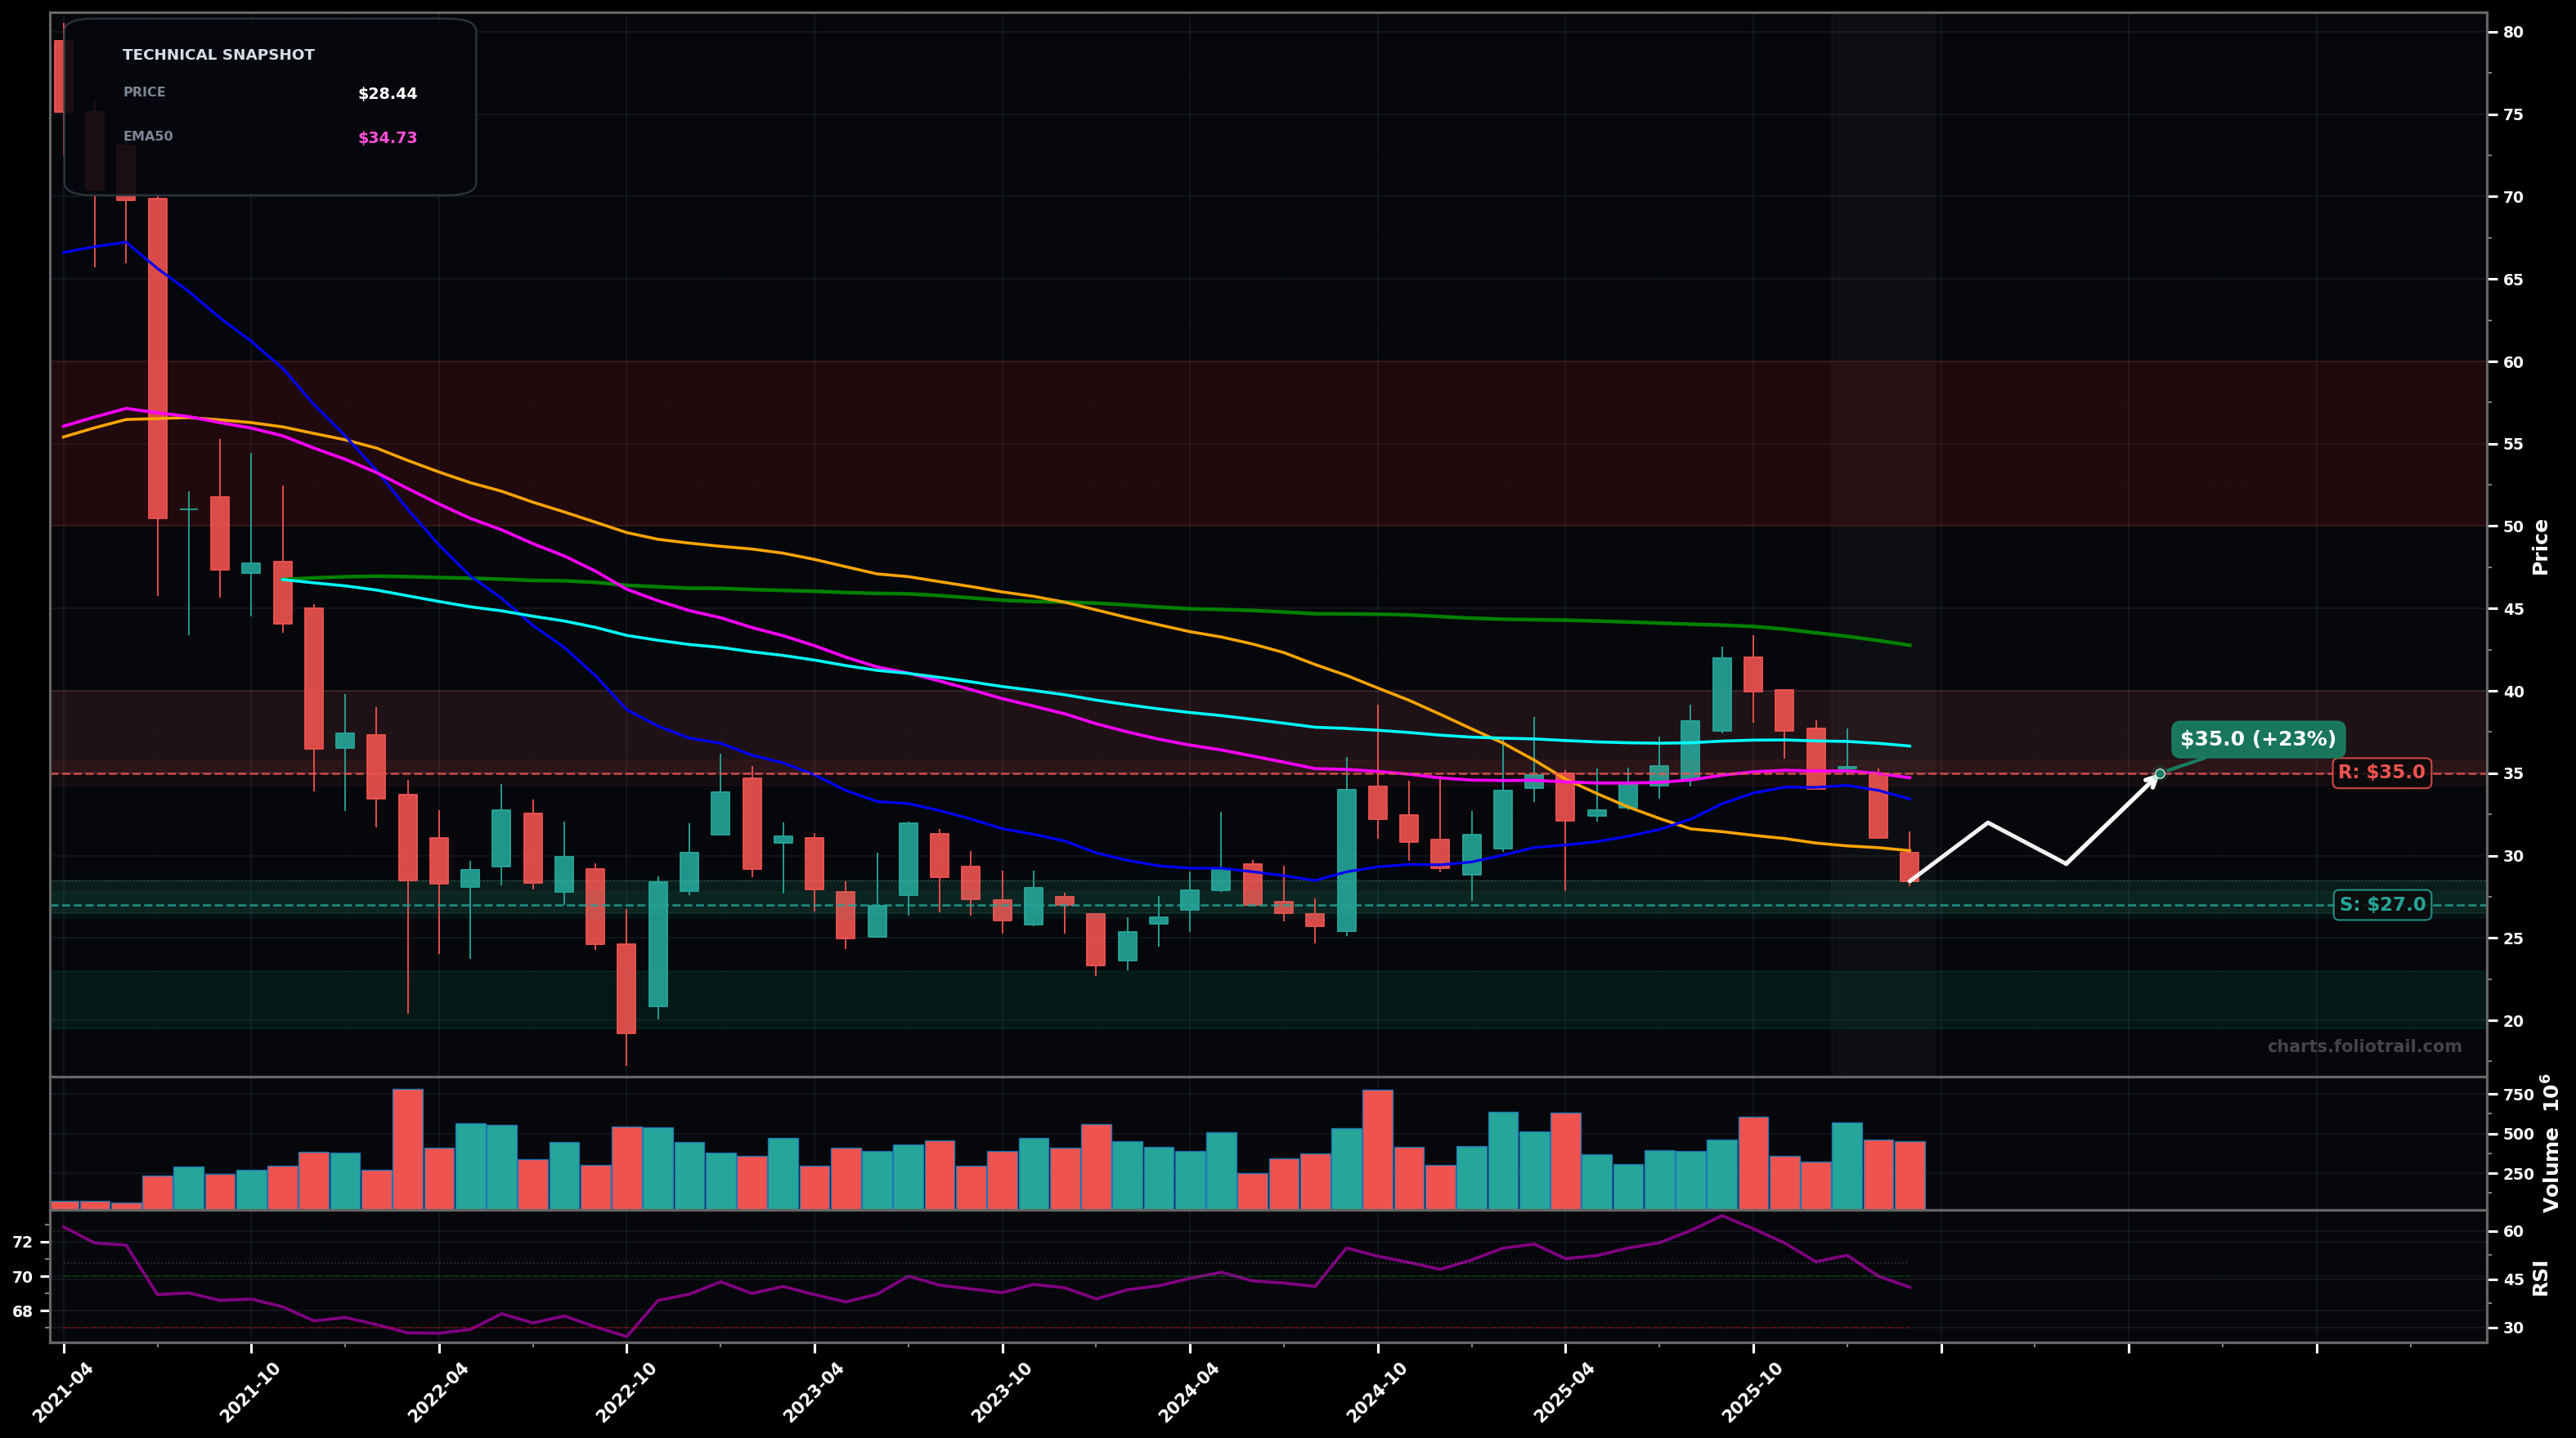
As of March 24, 2026, KWEB (KraneShares CSI China Internet ETF) is in a downtrend state on the monthly chart, with a confidence level of 67%. Key support is at $27.0 and key resistance at $35.0. Monthly rejected under the mid-$30s MAs and sold off back toward the high-$20s; RSI ~42 shows weak momentum without capitulation.
Base attempt: price holds ~$27 support, then mean-reverts toward the clustered EMA50/EMA100 resistance; choppy advance fits a larger Elliott corrective bounce (likely wave B within a broader bear/corrective structure).
Continuation leg down: failure to hold ~$27 triggers a sell-through toward the prior pivot zone; this would align with an Elliott wave C/3-type decline within the larger downtrend and likely tags deeper Fib retrace support.
Monthly close below $27.00 (breaks the recent swing-low support area).
2 consecutive monthly closes back above $36.70 (reclaim of EMA100/cyan with hold).
Start near current swing-low support; add on confirmed breakdown/flush into prior pivot demand; heavy add only at deeper multi-year support where downside-to-upside improves if a base forms.
Trim into the MA supply zone first (EMA50/EMA100 area), trim more into the next overhead pivot band, and fully close into a larger multi-year mean-reversion rally where price is likely extended versus long-term averages.
As of March 24, 2026, KWEB (KraneShares CSI China Internet ETF) is in a downtrend state on the monthly chart with 67% confidence. Monthly rejected under the mid-$30s MAs and sold off back toward the high-$20s; RSI ~42 shows weak momentum without capitulation.
On the monthly timeframe, KWEB has key support at $27.0 and key resistance at $35.0. The most likely scenario (bullish) targets $32.0 and $35.0, with a revert level at $29.5.
KWEB (KraneShares CSI China Internet ETF) is currently classified as downtrend on the monthly chart, with 67% confidence. Confirmation requires: Monthly close below $27.00 (breaks the recent swing-low support area). This would be invalidated by: 2 consecutive monthly closes back above $36.70 (reclaim of EMA100/cyan with hold).
The most likely scenario (bullish) targets $32.0 and $35.0, with a revert level at $29.5. The alternative scenario (bearish) targets $24.0 and $20.0.
All content on this website — including charts, analysis, price targets, support/resistance levels, and position zones — is generated entirely by AI and provided for educational and informational purposes only.
This is not financial advice. NEXUSNOIR VENTURES SL (the operator of this website) is not a registered investment adviser or broker-dealer. You should not make investment decisions based solely on this information. Always do your own research and consult a qualified financial advisor.
By continuing, you acknowledge that you have read and agree to our full disclaimer & terms of use and privacy policy.