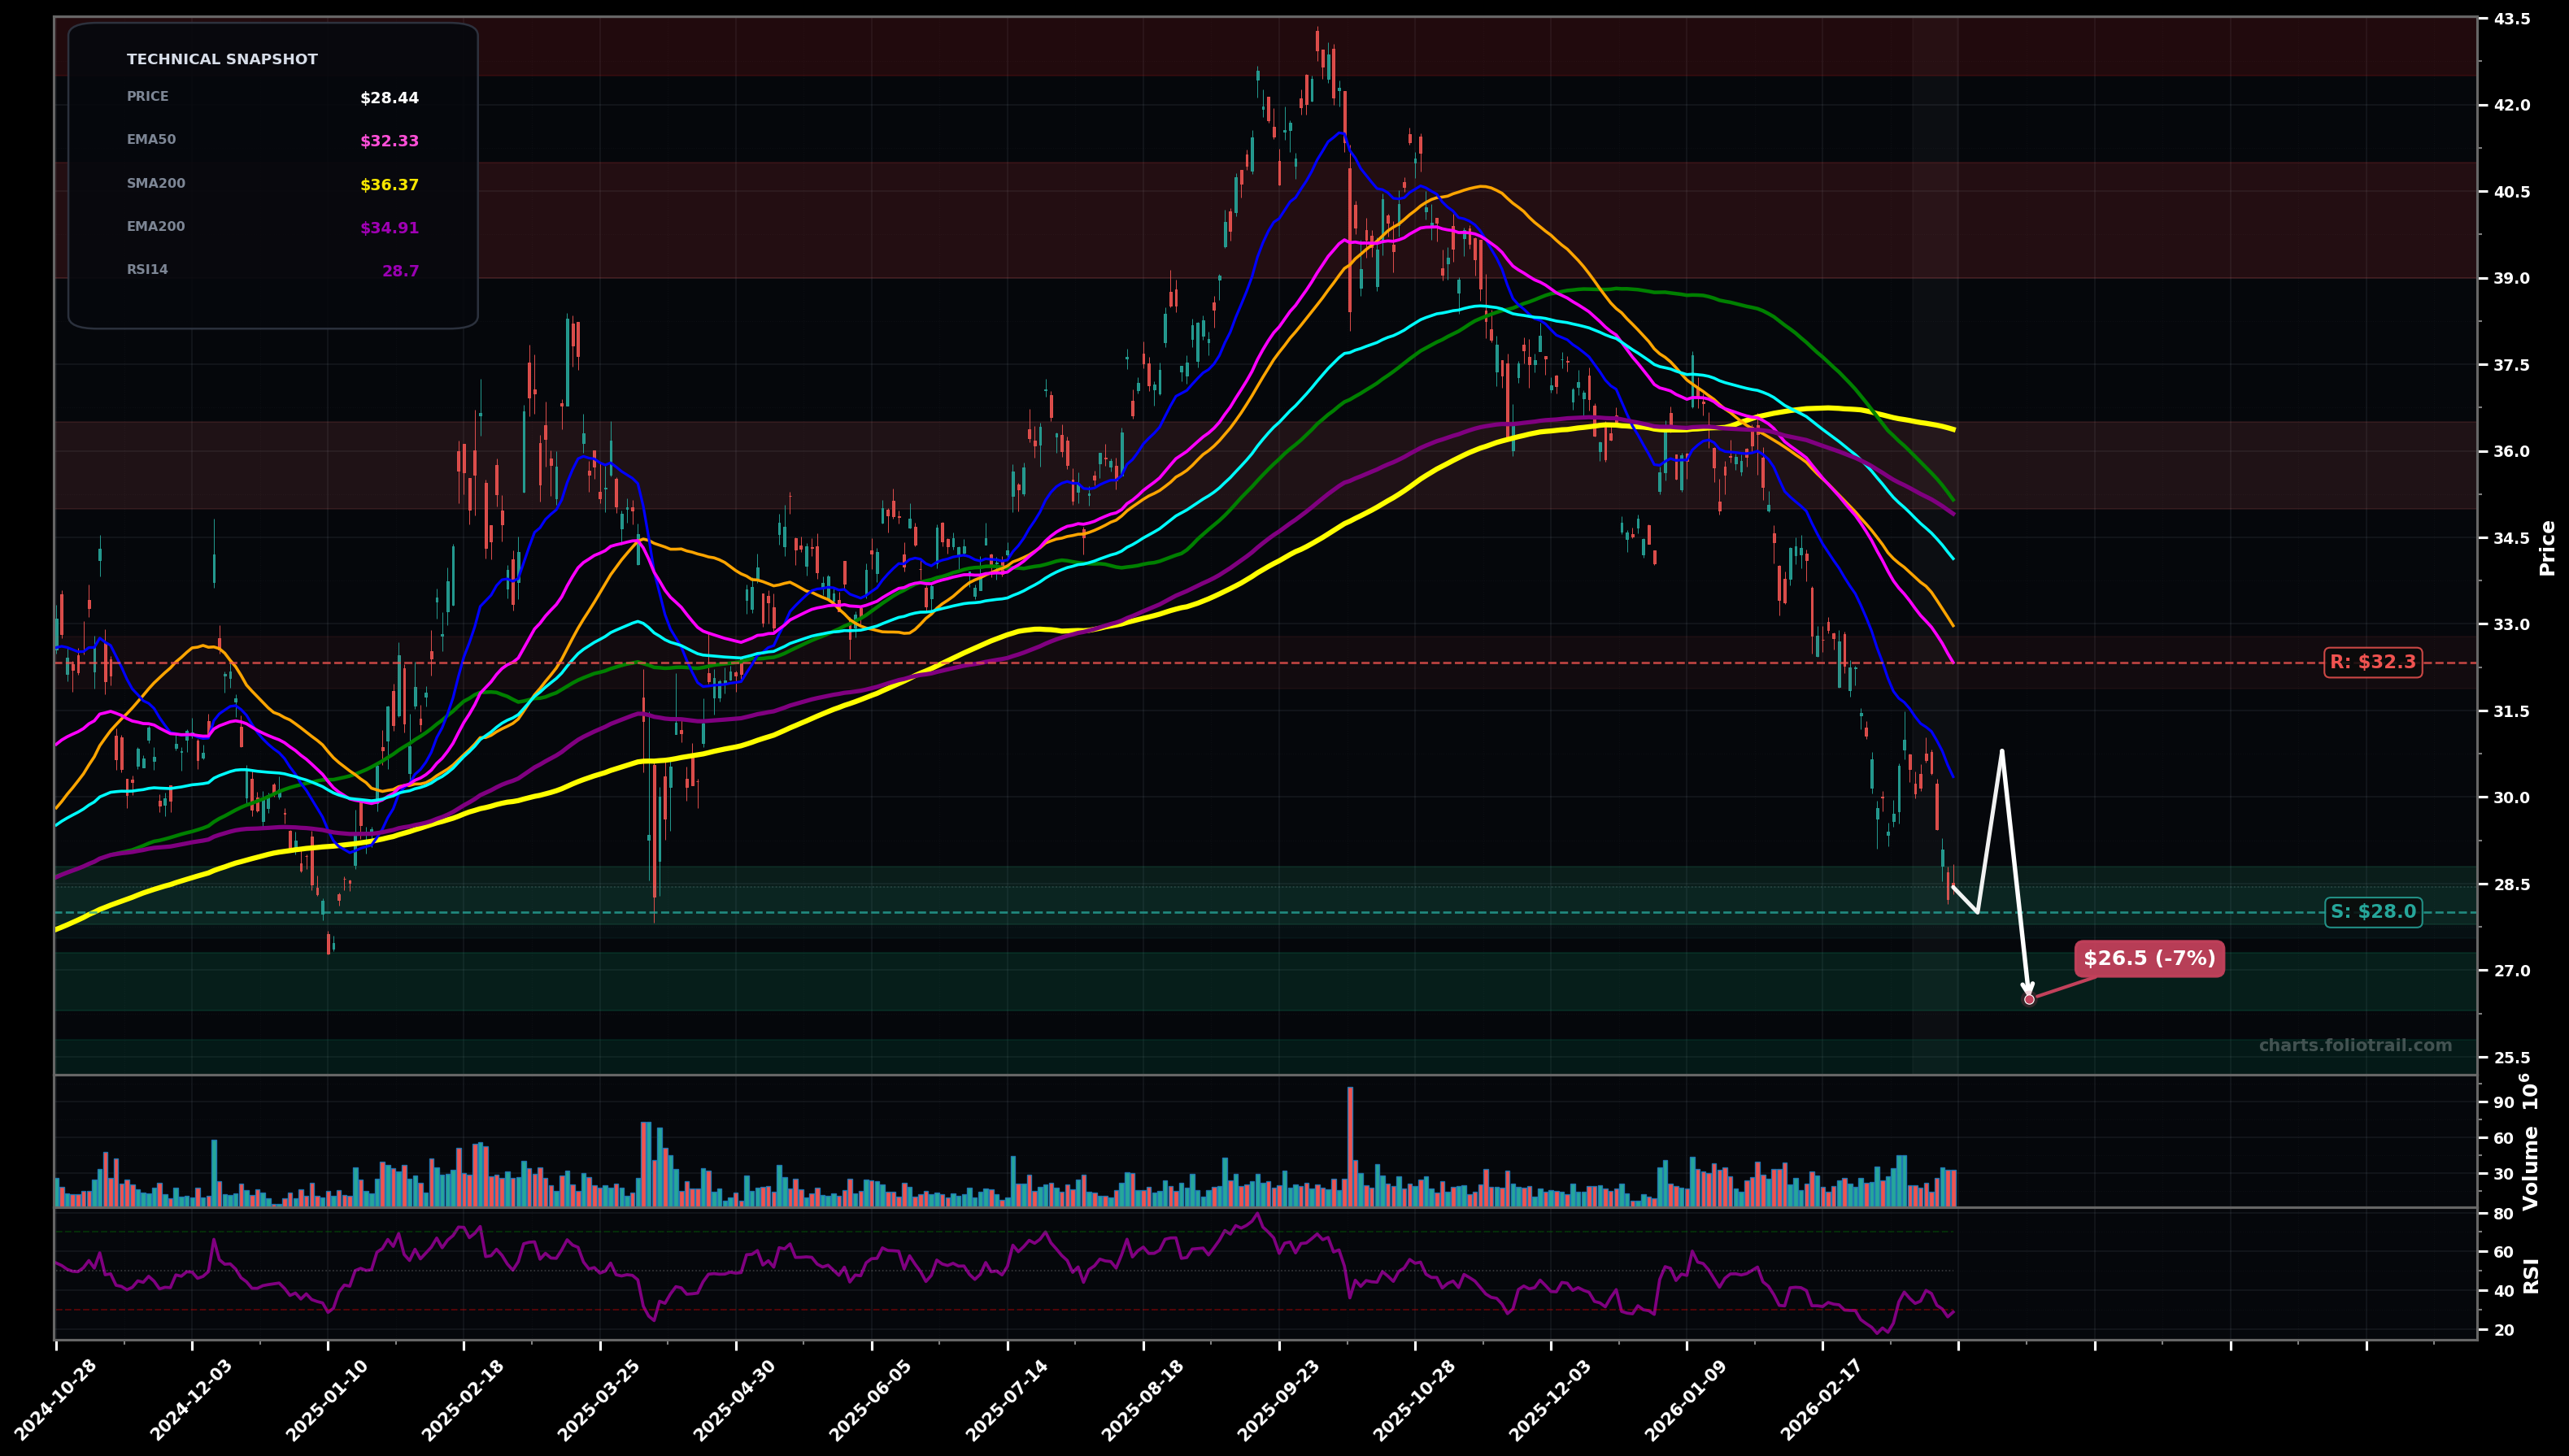
As of March 24, 2026, KWEB (KraneShares CSI China Internet ETF) is in a falling knife state on the daily chart, with a confidence level of 78%. Key support is at $28.0 and key resistance at $32.3. Sharp selloff to ~$28.44 with price far below all key MAs; RSI-14 ~28.7 (oversold) after consecutive breakdown legs.
Bearish continuation: oversold bounce attempts fade under the falling EMA50, followed by another leg down (Elliott: likely wave 5 extension of the decline from the ~$43.5 top).
Bullish mean-reversion: a relief rally from oversold RSI forms a tradable higher low, then a reclaim of EMA50 starts a larger ABC corrective bounce (Fib: typical 0.382–0.500 retrace of the last downswing).
Another daily close below $28.00 would confirm continued falling-knife behavior
Two consecutive daily closes back above $32.33 (EMA50) would invalidate falling-knife and shift to a bottoming attempt
Scaling near the current swing-low support (~$28) with adds on further breakdown to prior demand zones; heavy add only if capitulation extends (higher reward/risk) while still respecting the downtrend.
Trim into major overhead supply where SMA/EMA clusters and the prior distribution zone sit (~$35–$37 first, then ~$39–$41); fully exit near the prior top area (~$43–$44) where long-term upside becomes most stretched.
As of March 24, 2026, KWEB (KraneShares CSI China Internet ETF) is in a falling knife state on the daily chart with 78% confidence. Sharp selloff to ~$28.44 with price far below all key MAs; RSI-14 ~28.7 (oversold) after consecutive breakdown legs.
On the daily timeframe, KWEB has key support at $28.0 and key resistance at $32.3. The most likely scenario (bearish) targets $28.0 and $26.5, with a revert level at $30.8.
KWEB (KraneShares CSI China Internet ETF) is currently classified as falling knife on the daily chart, with 78% confidence. Confirmation requires: Another daily close below $28.00 would confirm continued falling-knife behavior This would be invalidated by: Two consecutive daily closes back above $32.33 (EMA50) would invalidate falling-knife and shift to a bottoming attempt
The most likely scenario (bearish) targets $28.0 and $26.5, with a revert level at $30.8. The alternative scenario (bullish) targets $32.3 and $34.1.
All content on this website — including charts, analysis, price targets, support/resistance levels, and position zones — is generated entirely by AI and provided for educational and informational purposes only.
This is not financial advice. NEXUSNOIR VENTURES SL (the operator of this website) is not a registered investment adviser or broker-dealer. You should not make investment decisions based solely on this information. Always do your own research and consult a qualified financial advisor.
By continuing, you acknowledge that you have read and agree to our full disclaimer & terms of use and privacy policy.