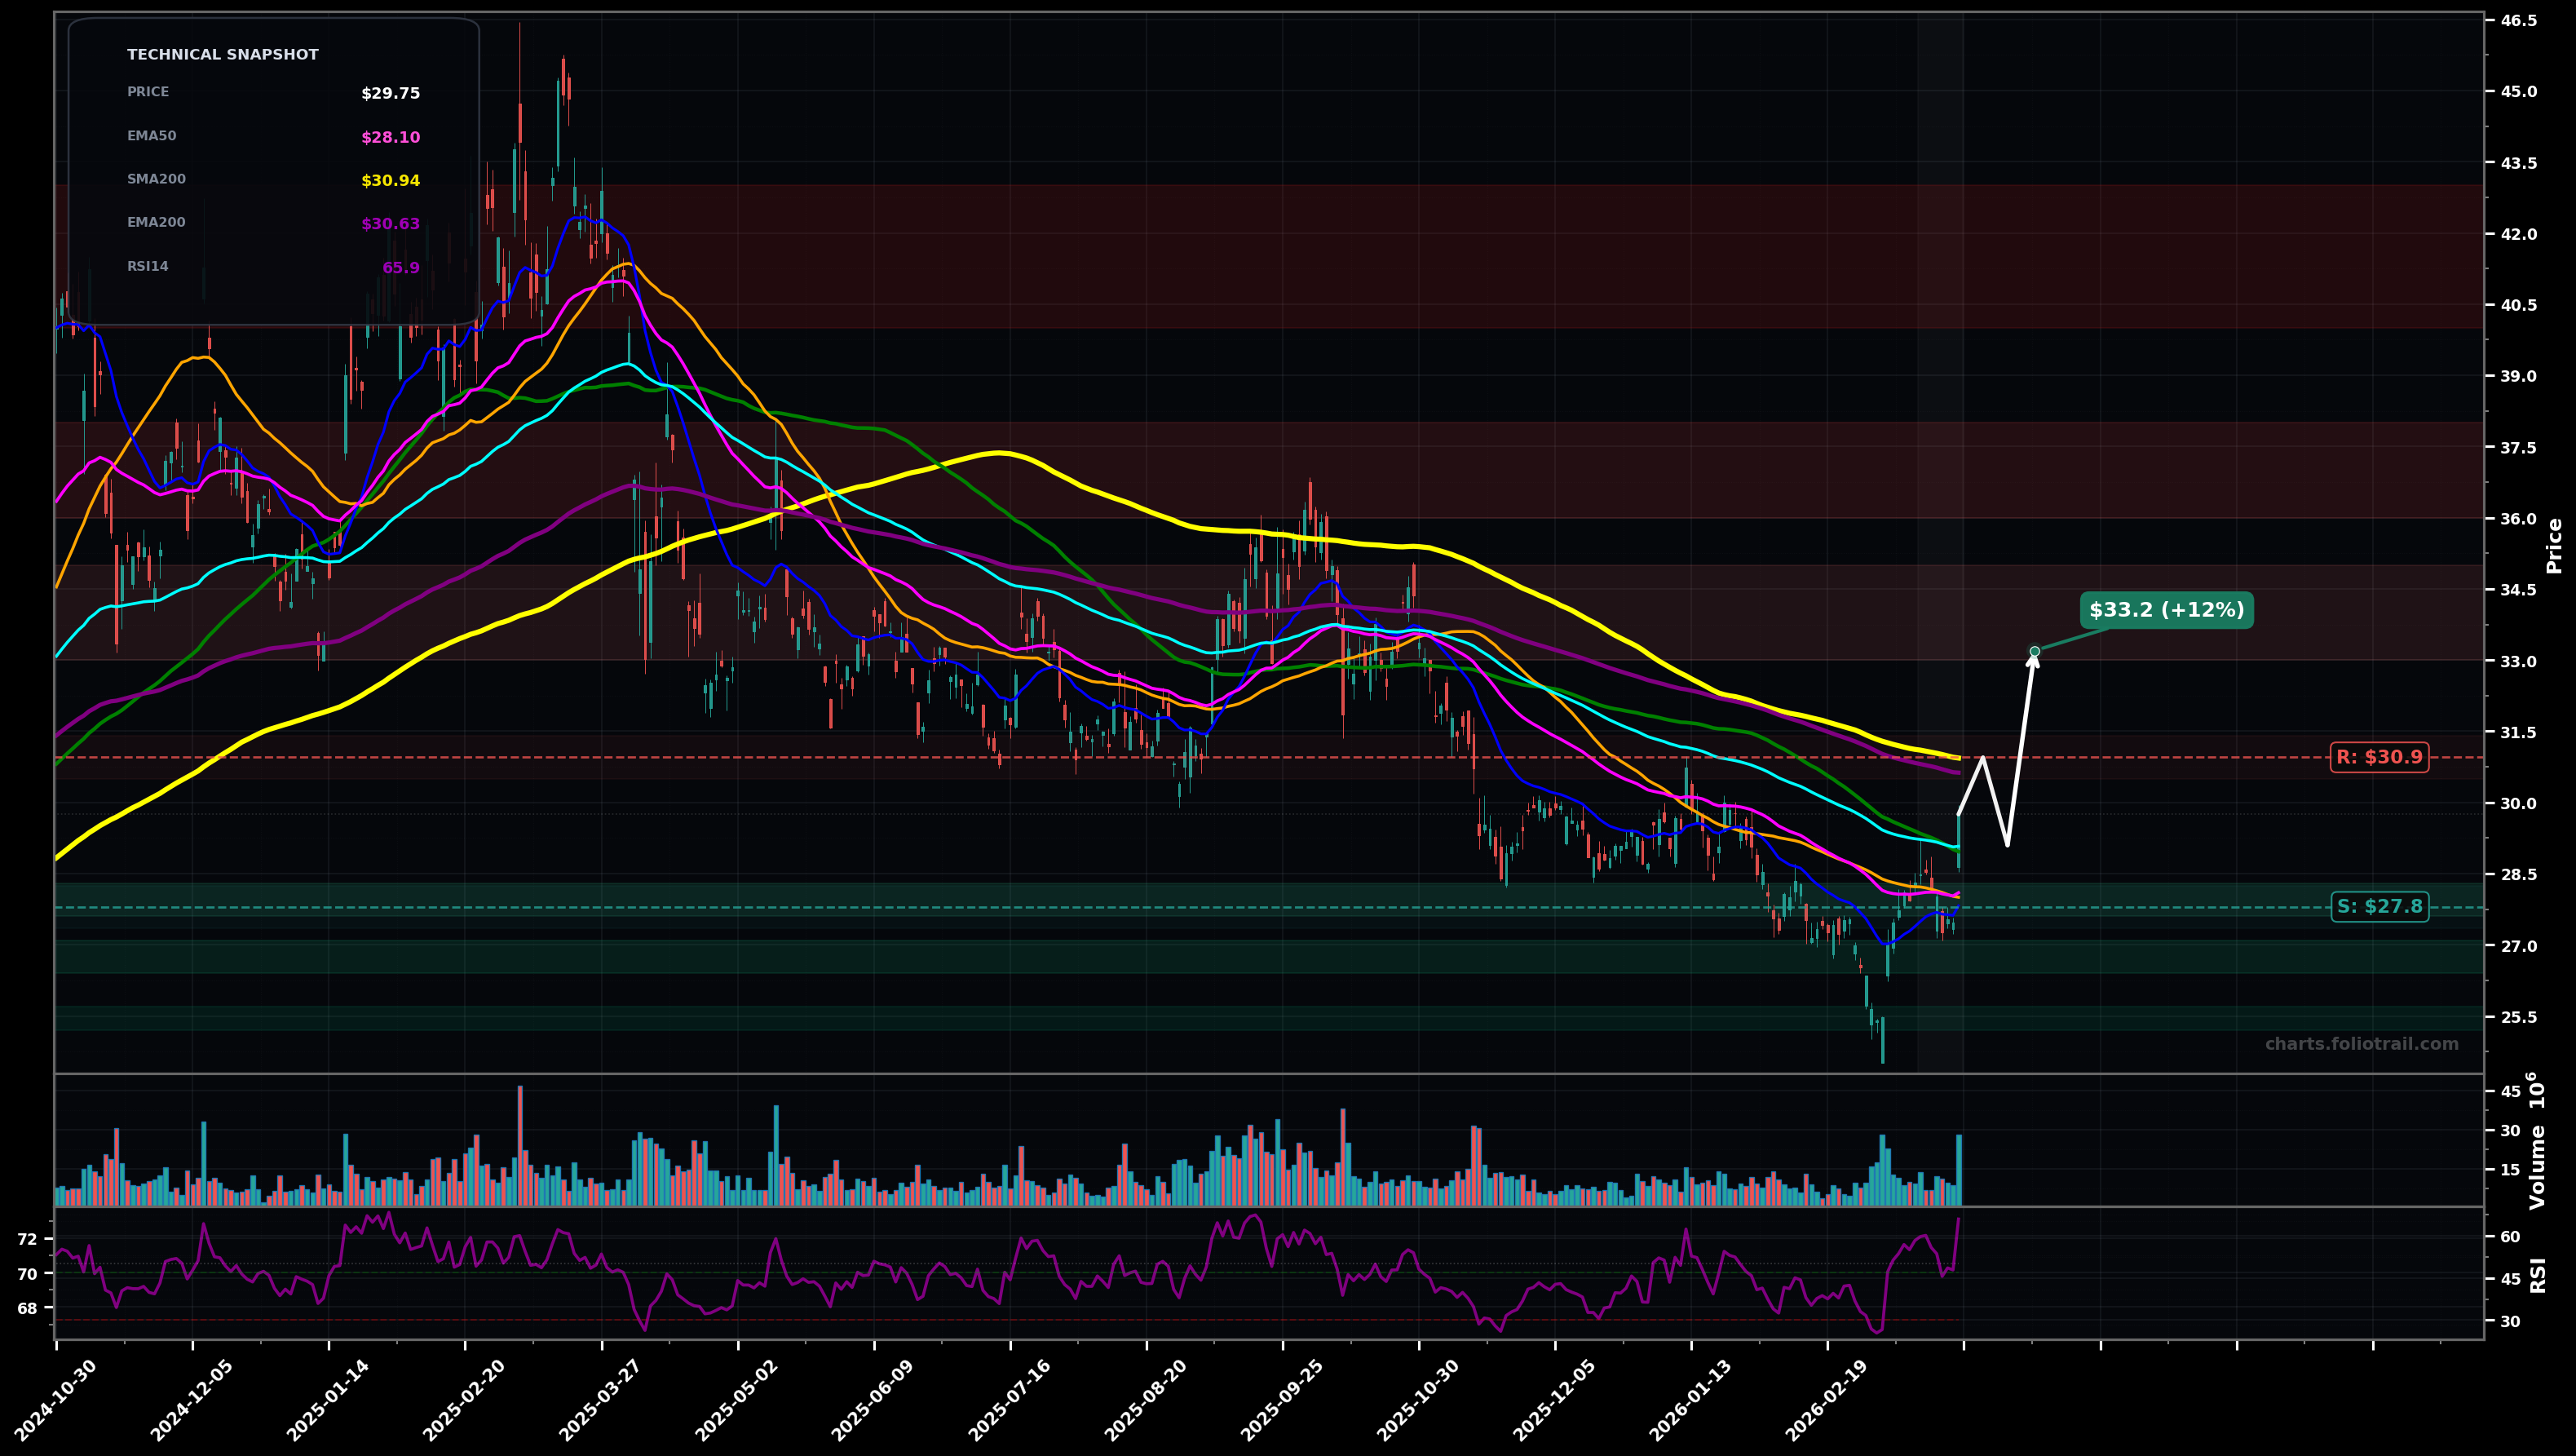
As of March 26, 2026, JD (JD.com Inc.) is in a bottoming attempt state on the daily chart, with a confidence level of 63%. Key support is at $27.8 and key resistance at $30.9. Sharp bounce off the recent swing low near ~$25.5 and reclaim of the short-term cluster (SMA50/EMA50) into ~$29.8, but price is still below the declining EMA100/EMA200 and SMA200.
Mean-reversion rally continues as a counter-trend Wave (2)/(B): price holds above ~$27.8, then works up into the heavy MA supply (EMA100/EMA200/SMA200) and stalls/pulls back before attempting a second push.
Bounce fails into resistance (likely near SMA200/EMA200), forming a LH and restarting the primary downtrend (Wave (3)/(C) continuation) toward the prior swing low and potentially a new LL.
Daily closes hold above ~$30.10 (reclaim/hold EMA100-SMA200 area) for 2+ sessions
Break and close back below ~$27.80 (loss of reclaimed EMA50/SMA50 support zone)
Accumulation zones are built around reclaimed EMA50/SMA50 support first, then prior breakdown area, with heavy add at the swing-low reference (~$25.5) where capitulation risk/reward is best.
Trim into overhead MA stack and prior distribution highs: ~$33-35 aligns with first major supply, ~$36-38 matches the next resistance shelf, and ~$40-43 is the larger prior peak zone where upside gets most stretched.
As of March 26, 2026, JD (JD.com Inc.) is in a bottoming attempt state on the daily chart with 63% confidence. Sharp bounce off the recent swing low near ~$25.5 and reclaim of the short-term cluster (SMA50/EMA50) into ~$29.8, but price is still below the declining EMA100/EMA200 and SMA200.
On the daily timeframe, JD has key support at $27.8 and key resistance at $30.9. The most likely scenario (bullish) targets $30.9 and $33.2, with a revert level at $29.1.
JD (JD.com Inc.) is currently classified as bottoming attempt on the daily chart, with 63% confidence. Confirmation requires: Daily closes hold above ~$30.10 (reclaim/hold EMA100-SMA200 area) for 2+ sessions This would be invalidated by: Break and close back below ~$27.80 (loss of reclaimed EMA50/SMA50 support zone)
The most likely scenario (bullish) targets $30.9 and $33.2, with a revert level at $29.1. The alternative scenario (bearish) targets $27.0 and $25.5.
Multi-layer AI agents analyse 200+ stocks across daily, weekly, and monthly timeframes — producing market state classifications, price scenarios with targets, and position entry/exit levels. Updated every trading day after market close. No paywall. No sign-up required.
Built by Foliotrail.
All content on this website — including charts, analysis, price targets, support/resistance levels, and position zones — is generated entirely by AI and provided for educational and informational purposes only.
This is not financial advice. NEXUSNOIR VENTURES SL (the operator of this website) is not a registered investment adviser or broker-dealer. You should not make investment decisions based solely on this information. Always do your own research and consult a qualified financial advisor.
By continuing, you acknowledge that you have read and agree to our full disclaimer & terms of use and privacy policy.