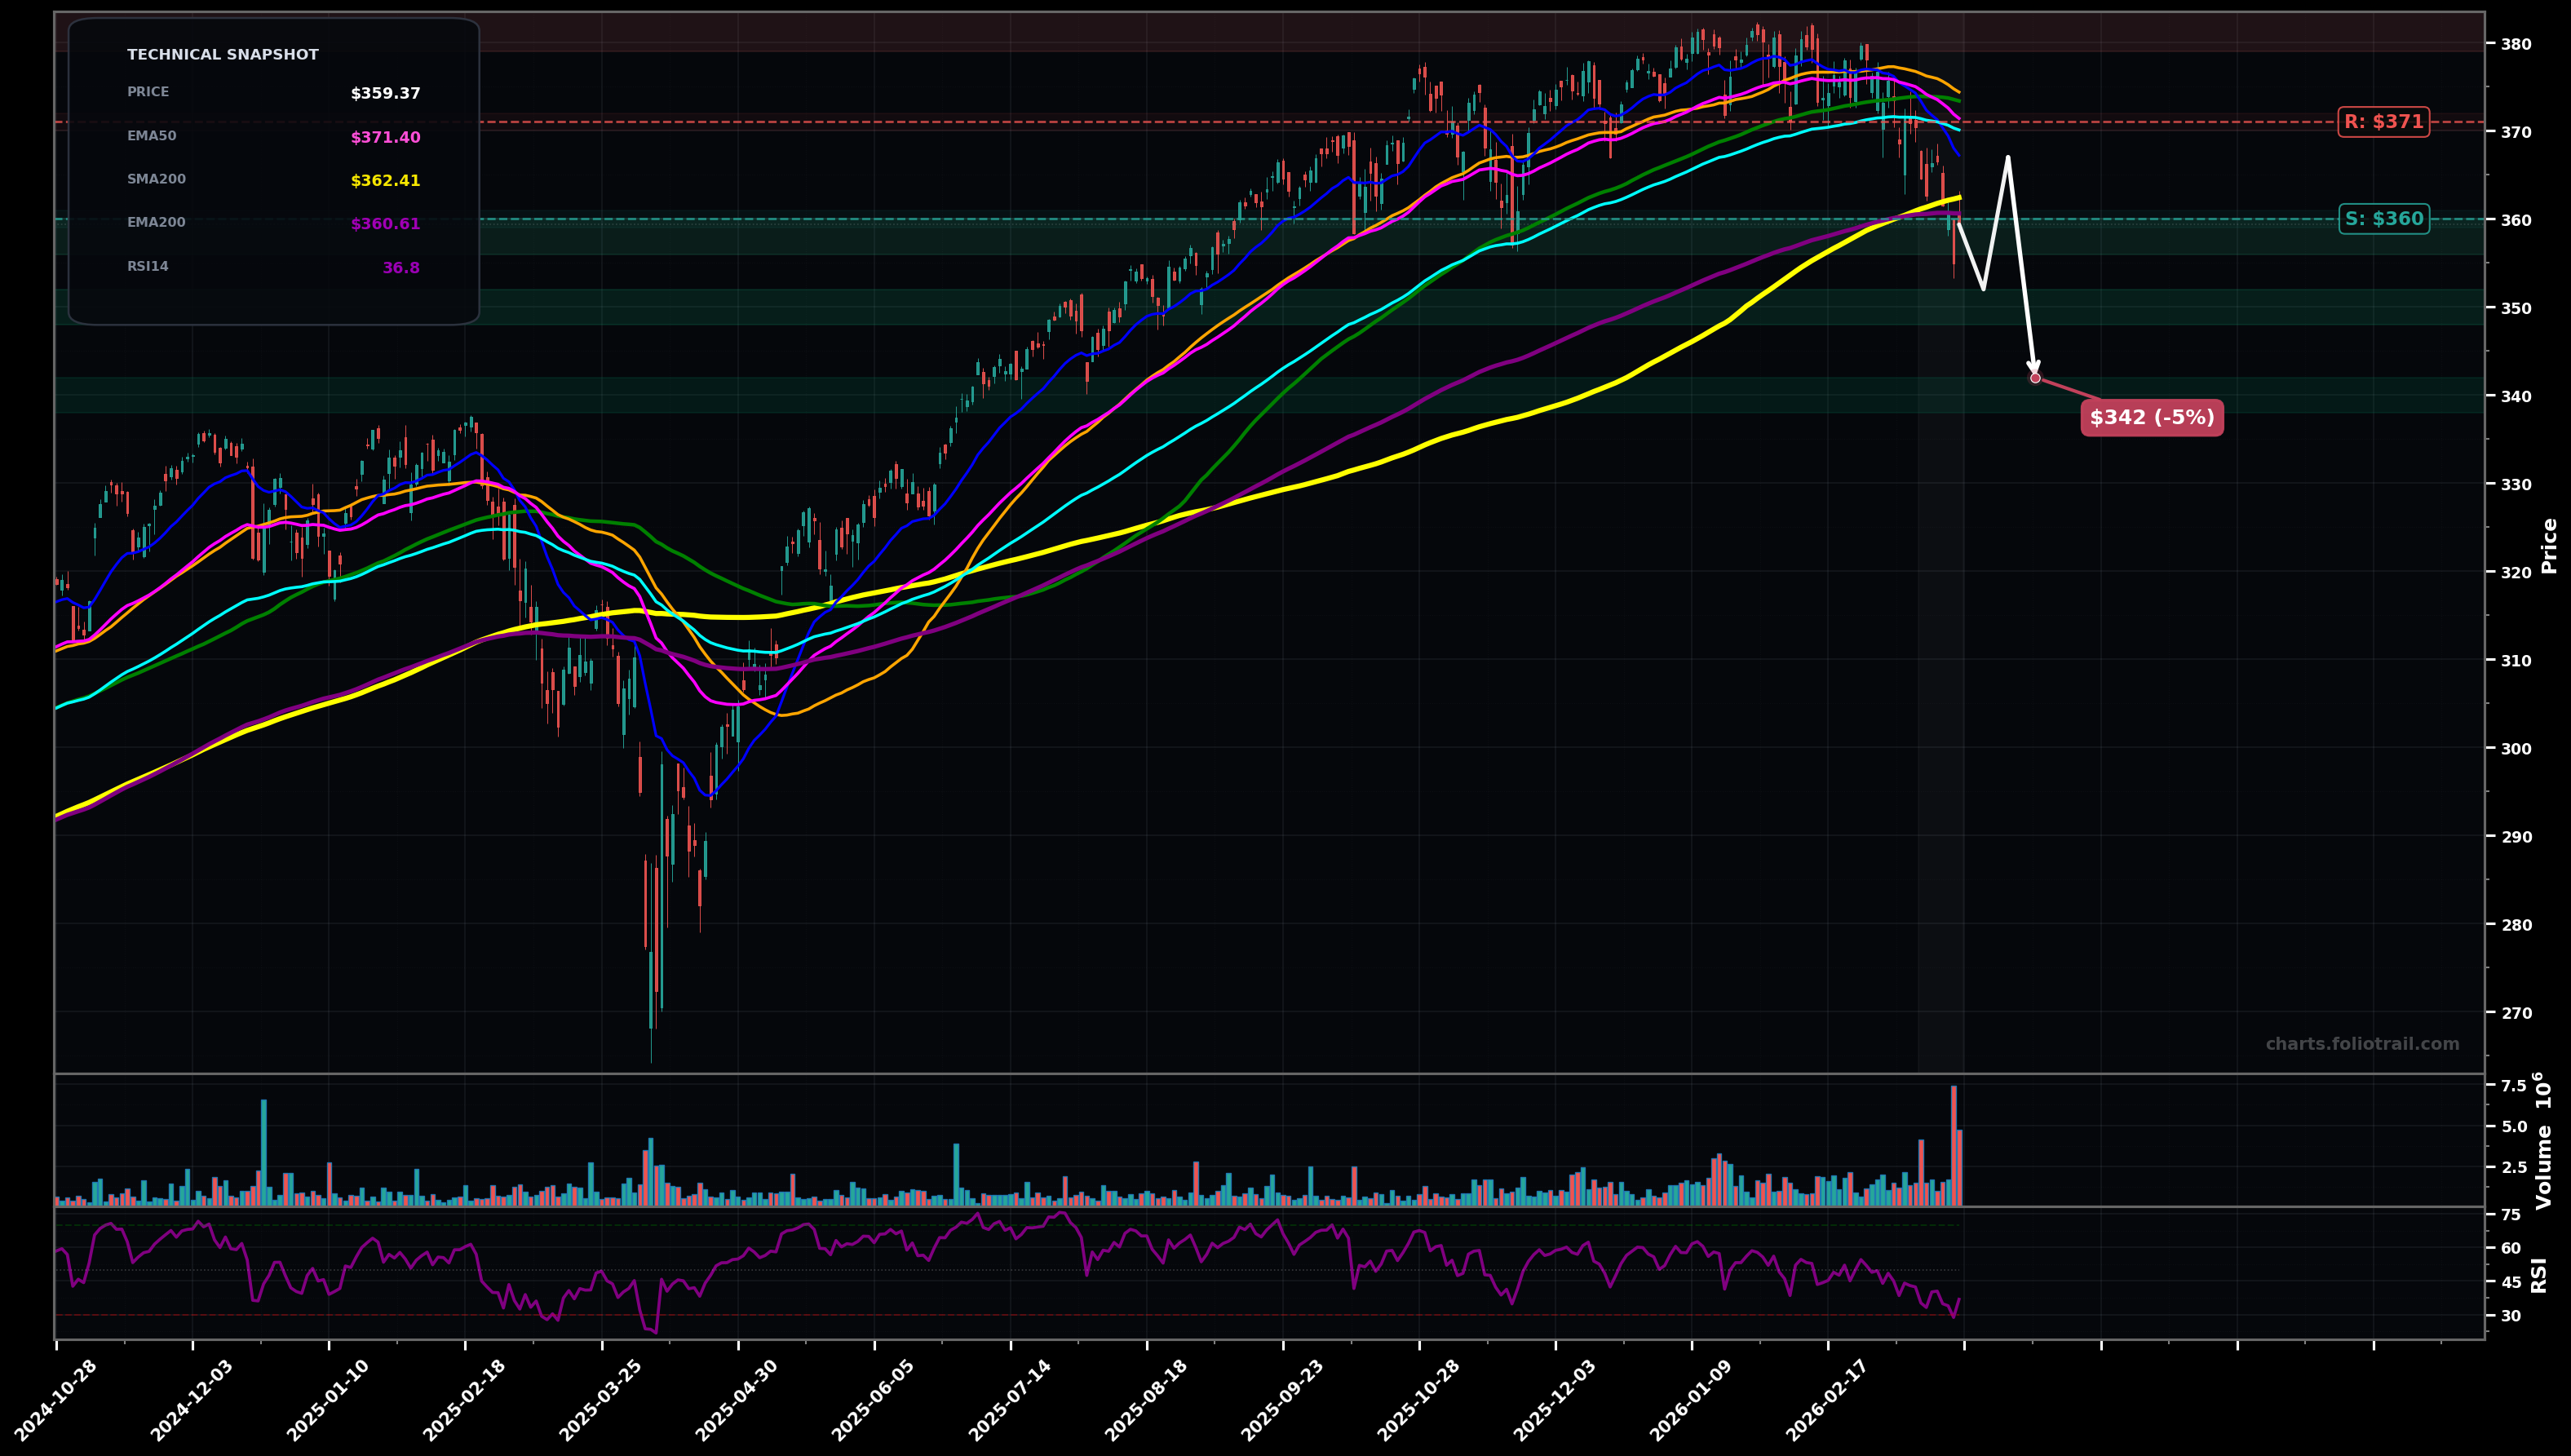
As of March 24, 2026, IWB (iShares Russell 1000 ETF) is in a downtrend state on the daily chart, with a confidence level of 67%. Key support is at $360 and key resistance at $371. Sharp selloff from the $380s with a high-volume breakdown; price ($359.37) is now below EMA50/EMA100 and testing the EMA200/SMA200 cluster (~$360–$362) with RSI14 ~36 (weak momentum).
Bearish continuation: failure to reclaim $371 leads to a breakdown under the $360 MA cluster, with a retest/rejection near $366–$368 before sliding to the next demand zone.
Bullish mean-reversion: hold the $360 area (EMA200/SMA200) and reclaim $371, then rotate back into the prior congestion near the $380s (lower-high risk).
Daily close below $358 would confirm continuation lower (loss of the EMA200/SMA200 zone).
Two daily closes back above $371 would invalidate the immediate downtrend (reclaim EMA50/EMA100).
Scale-in around the EMA200/SMA200 pivot ($360) first; add on breakdown/retest into the next fib-demand band ($352) and deploy heavily only if price flushes to the deeper support pocket (~$340s).
Trim into prior ATH supply ($380s) and higher extension zones; close if price reaches multi-year stretched extensions well above long MAs (likely late-cycle/impulse wave exhaustion).
As of March 24, 2026, IWB (iShares Russell 1000 ETF) is in a downtrend state on the daily chart with 67% confidence. Sharp selloff from the $380s with a high-volume breakdown; price ($359.37) is now below EMA50/EMA100 and testing the EMA200/SMA200 cluster (~$360–$362) with RSI14 ~36 (weak momentum).
On the daily timeframe, IWB has key support at $360 and key resistance at $371. The most likely scenario (bearish) targets $352 and $342, with a revert level at $367.
IWB (iShares Russell 1000 ETF) is currently classified as downtrend on the daily chart, with 67% confidence. Confirmation requires: Daily close below $358 would confirm continuation lower (loss of the EMA200/SMA200 zone). This would be invalidated by: Two daily closes back above $371 would invalidate the immediate downtrend (reclaim EMA50/EMA100).
The most likely scenario (bearish) targets $352 and $342, with a revert level at $367. The alternative scenario (bullish) targets $371 and $380.
All content on this website — including charts, analysis, price targets, support/resistance levels, and position zones — is generated entirely by AI and provided for educational and informational purposes only.
This is not financial advice. NEXUSNOIR VENTURES SL (the operator of this website) is not a registered investment adviser or broker-dealer. You should not make investment decisions based solely on this information. Always do your own research and consult a qualified financial advisor.
By continuing, you acknowledge that you have read and agree to our full disclaimer & terms of use and privacy policy.