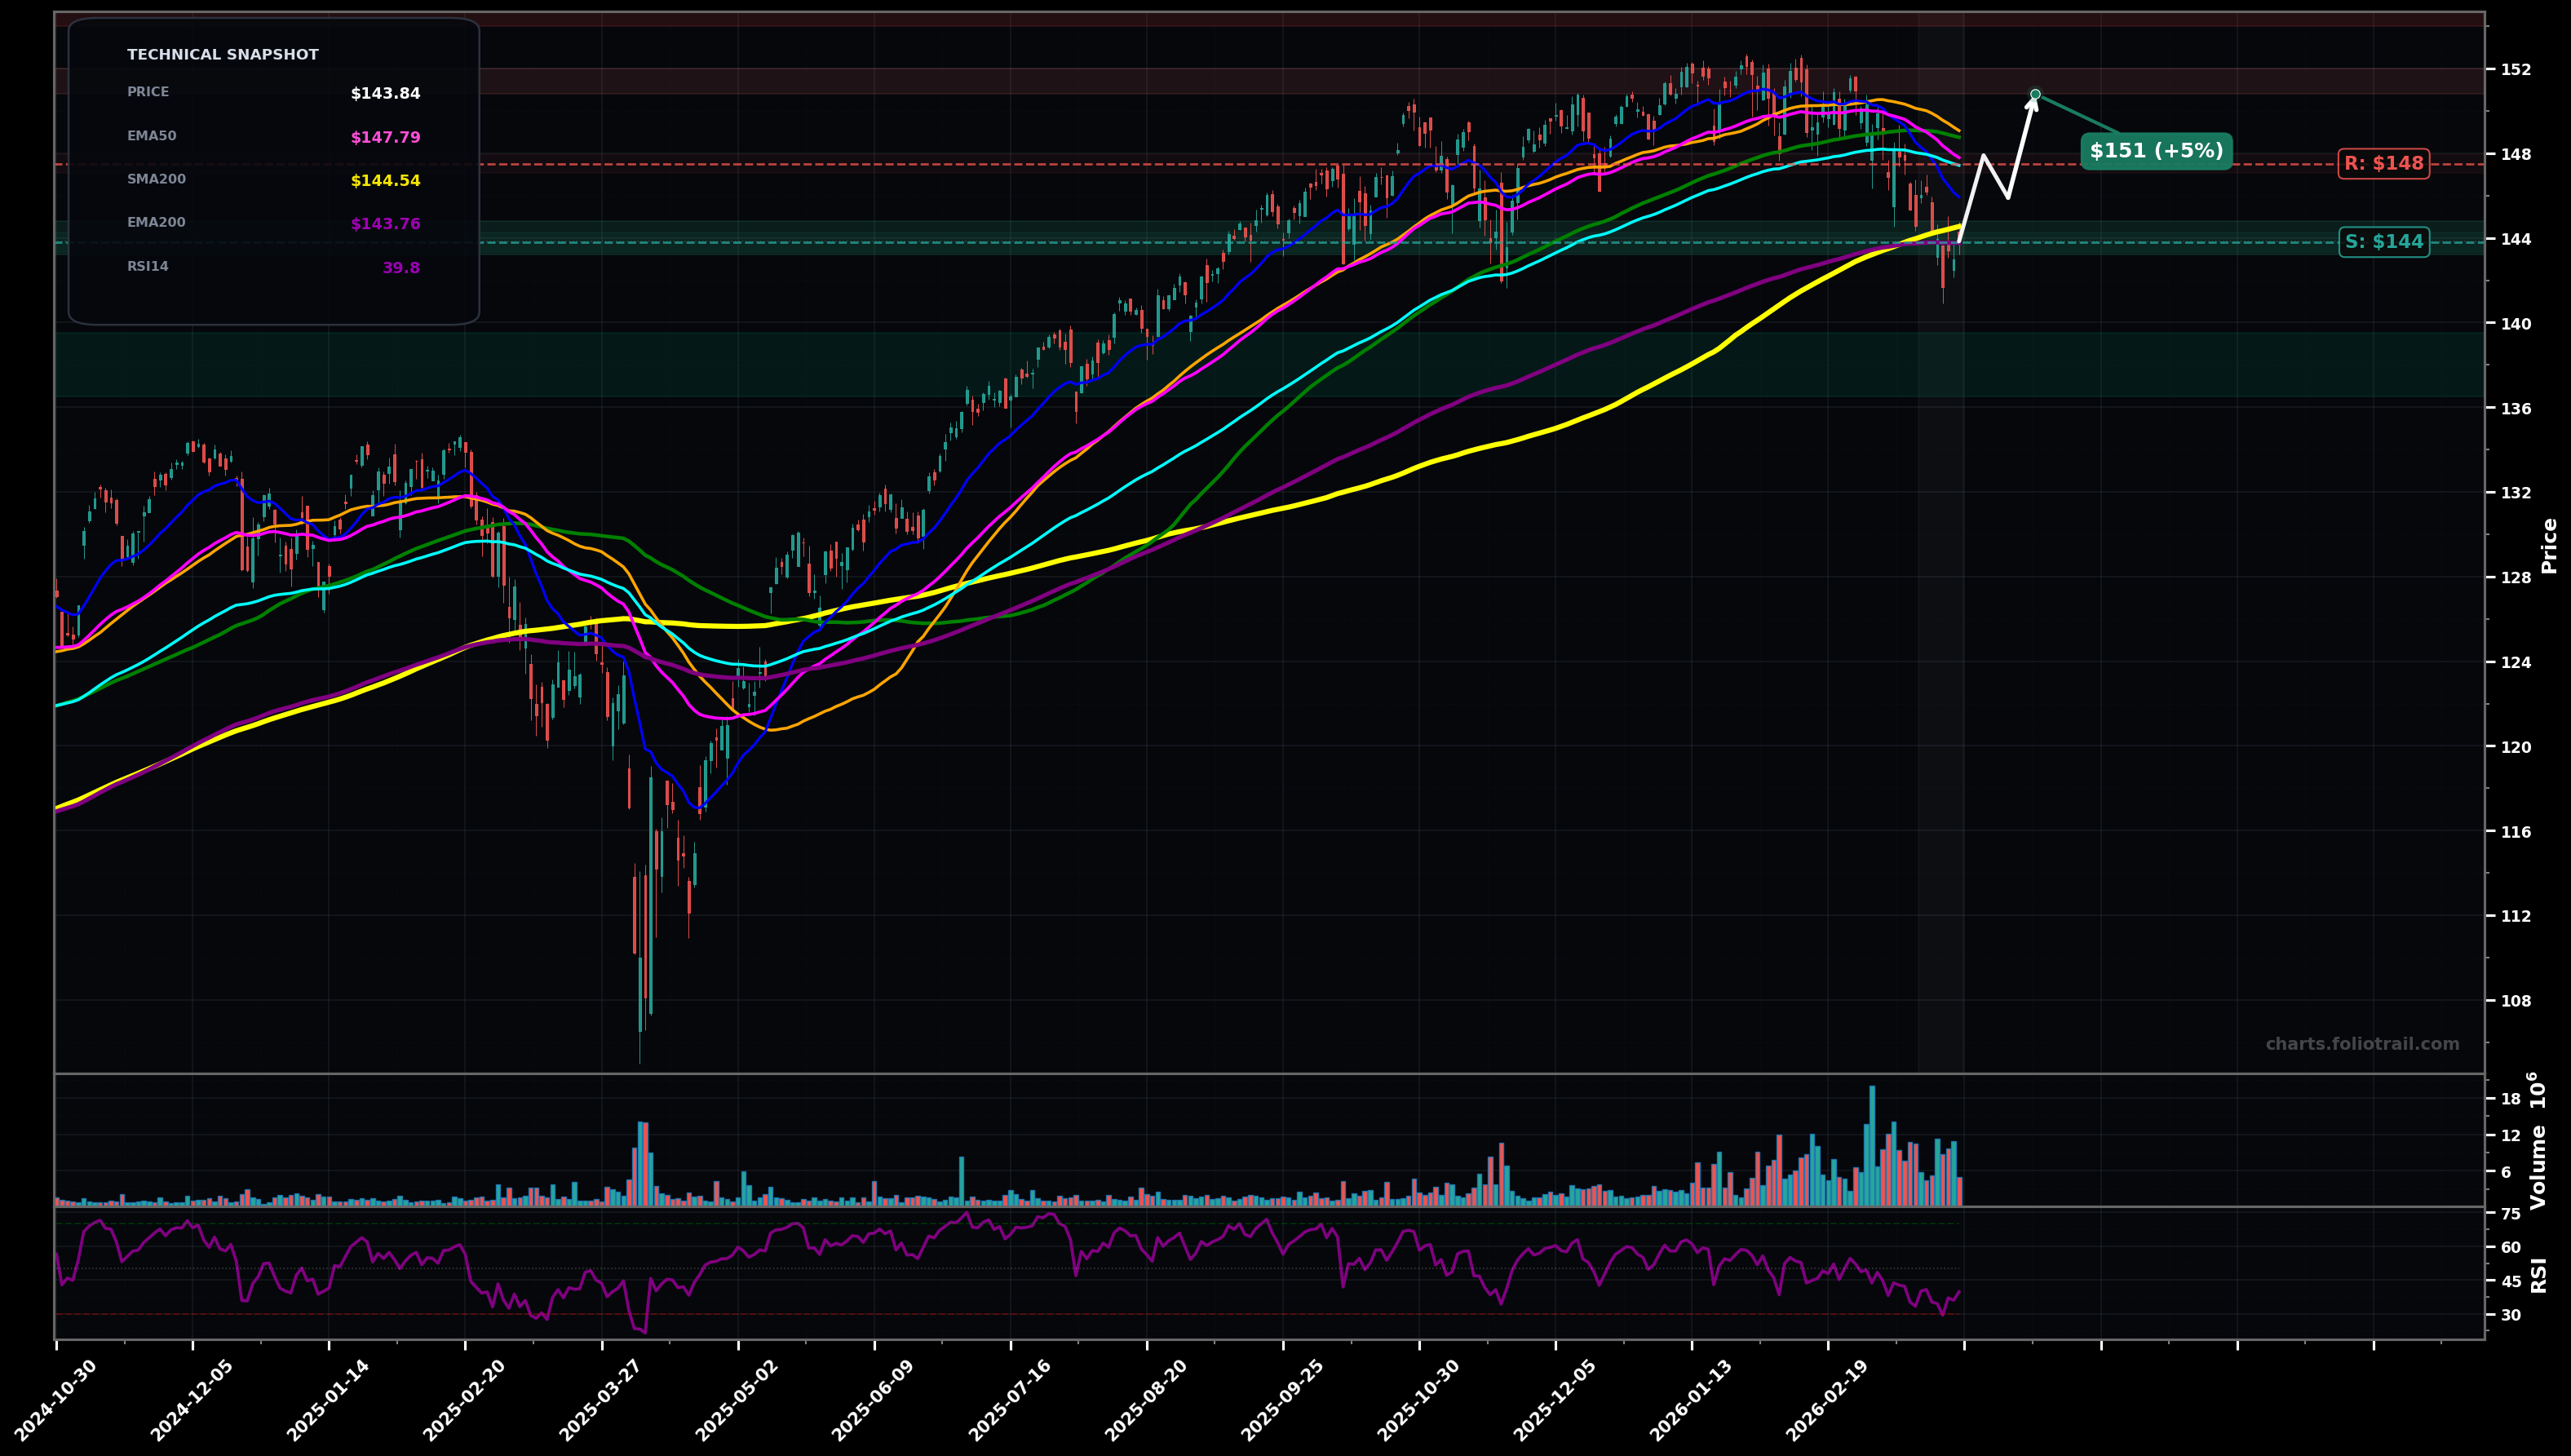
As of March 26, 2026, ITOT (iShares Core S&P Total U.S. Stock Market ETF) is in a bottoming attempt state on the daily chart, with a confidence level of 58%. Key support is at $144 and key resistance at $148. Sharp pullback from the $151-$152 area; price ($143.84) is sitting on/just above EMA200 (~$143.76) while below EMA50/EMA100; RSI ~39.8 shows weak momentum but near oversold-adjacent.
Support holds at the EMA200/SMA200 confluence and ITOT mean-reverts upward; likely a Wave-4 style pullback completing, followed by an ABC rebound into prior supply.
Breakdown below the long-term average cluster triggers a larger correction (ABC or start of a new down leg), with price seeking the next demand zone from the prior base.
2 consecutive daily closes back above $147.50 (reclaim EMA100/near breakdown area) would confirm a bottoming attempt
Daily close below $142.80 would invalidate and shift risk toward a deeper trend break
Start near EMA200/SMA200 confluence; add on confirmed breakdown retest/next demand; heavy add at deeper Fib-style retrace zone + prior structure support.
Trim into prior ATH/supply ($151-$152); more trimming if a breakout gets extended above prior highs; close if price becomes multi-year stretched versus long MAs (late-cycle extension risk).
As of March 26, 2026, ITOT (iShares Core S&P Total U.S. Stock Market ETF) is in a bottoming attempt state on the daily chart with 58% confidence. Sharp pullback from the $151-$152 area; price ($143.84) is sitting on/just above EMA200 (~$143.76) while below EMA50/EMA100; RSI ~39.8 shows weak momentum but near oversold-adjacent.
On the daily timeframe, ITOT has key support at $144 and key resistance at $148. The most likely scenario (bullish) targets $148 and $151, with a revert level at $146.
ITOT (iShares Core S&P Total U.S. Stock Market ETF) is currently classified as bottoming attempt on the daily chart, with 58% confidence. Confirmation requires: 2 consecutive daily closes back above $147.50 (reclaim EMA100/near breakdown area) would confirm a bottoming attempt This would be invalidated by: Daily close below $142.80 would invalidate and shift risk toward a deeper trend break
The most likely scenario (bullish) targets $148 and $151, with a revert level at $146. The alternative scenario (bearish) targets $141 and $136.
Multi-layer AI agents analyse 200+ stocks across daily, weekly, and monthly timeframes — producing market state classifications, price scenarios with targets, and position entry/exit levels. Updated every trading day after market close. No paywall. No sign-up required.
Built by Foliotrail.
All content on this website — including charts, analysis, price targets, support/resistance levels, and position zones — is generated entirely by AI and provided for educational and informational purposes only.
This is not financial advice. NEXUSNOIR VENTURES SL (the operator of this website) is not a registered investment adviser or broker-dealer. You should not make investment decisions based solely on this information. Always do your own research and consult a qualified financial advisor.
By continuing, you acknowledge that you have read and agree to our full disclaimer & terms of use and privacy policy.