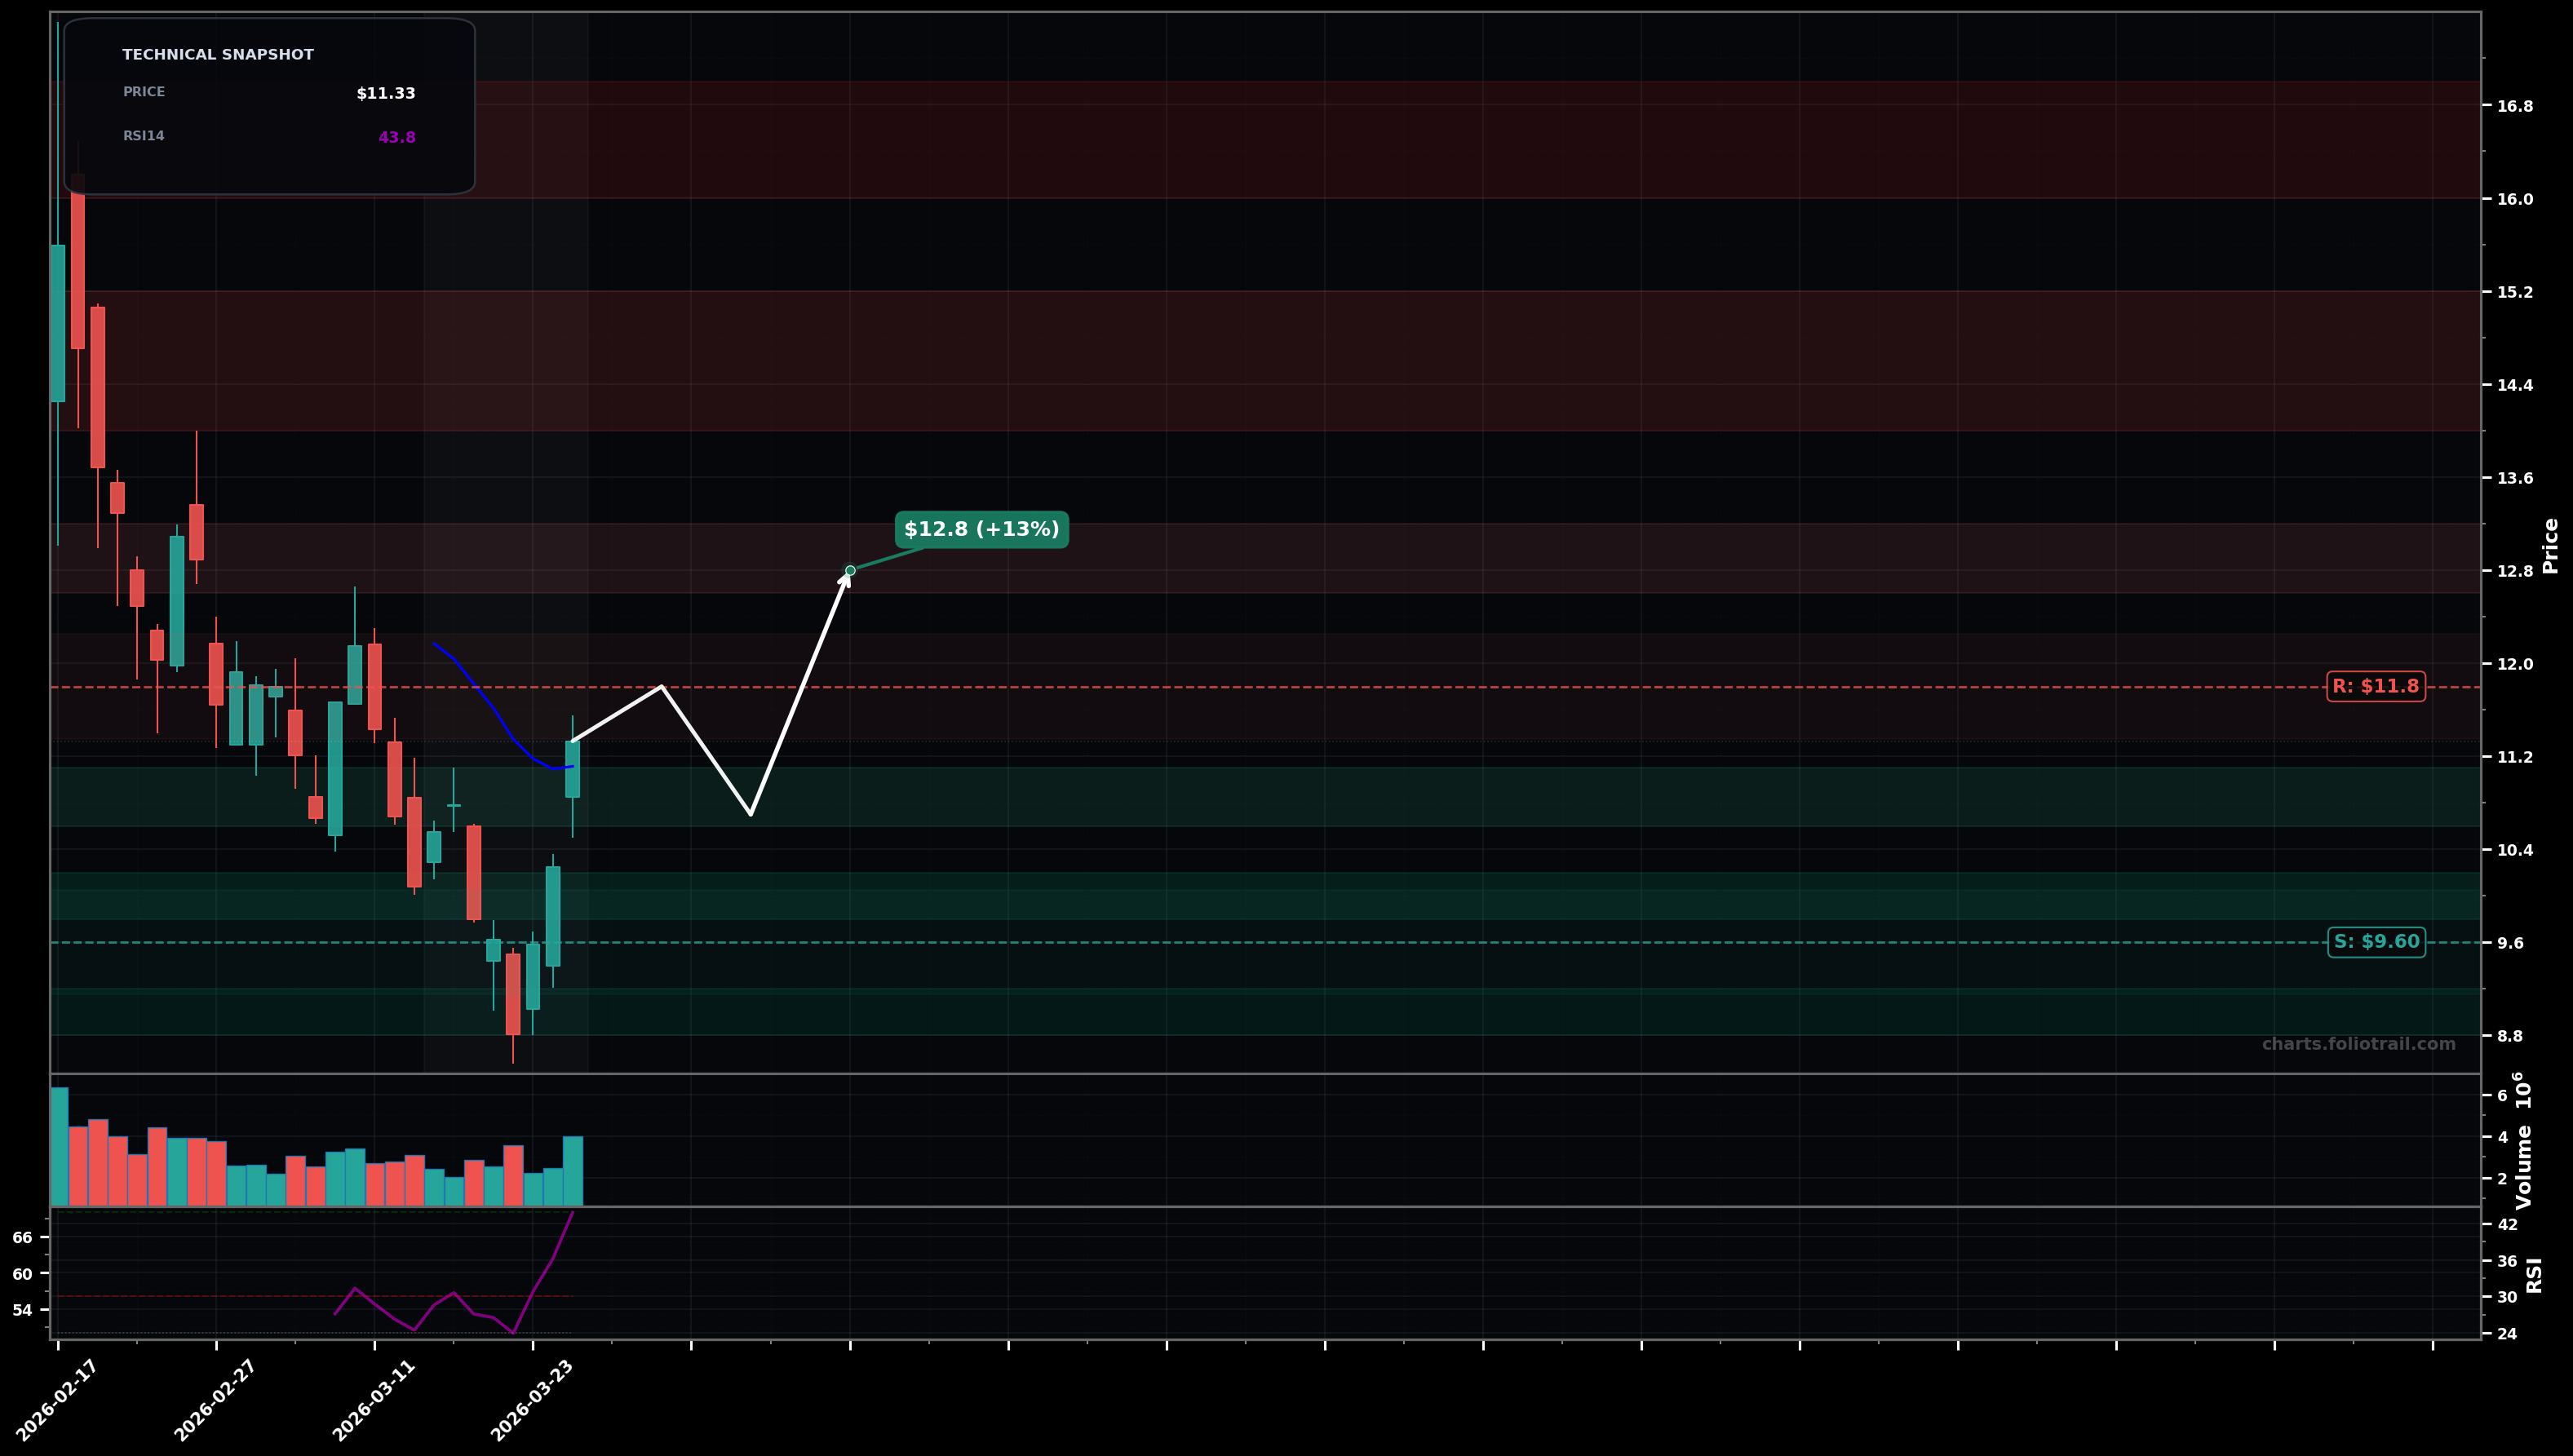
As of March 26, 2026, INFQ (Infleqtion Inc.) is in a bottoming attempt state on the daily chart, with a confidence level of 64%. Key support is at $9.60 and key resistance at $11.8. Sharp rebound from a ~$8.8 swing low with 3 strong green candles, reclaiming the short-term EMA (~$11.1) and closing near ~$11.33 with improving momentum (RSI ~43.8).
Base-to-reclaim continuation: price consolidates above $11.10, then pushes through $11.80 and grinds toward the next supply zone; this fits a potential Elliott Wave (A-B-C) where the current leg is a C/impulse off the capitulation low.
Failed rebound: rejection near $11.80 leads to a pullback to retest the breakout area; if that retest breaks, price revisits the prior swing low (classic bear-market rally failure / Wave 2 fade).
Hold above $11.10 and then break/close above $11.80 (recent swing supply) for 2 sessions
Daily close back below $9.60 (loss of the rebound structure); stronger invalidation below $8.80
Start on EMA-reclaim retest ($11.1 area), add on deeper pullback into prior consolidation ($10 area), heavy add only on swing-low support retest ($8.8-$9.2) where invalidation is clear.
Trim into prior breakdown/supply zones and likely Fib retracements of the whole drop (first around ~$12.8, then ~$14-$15+), with full exit into extreme mean-reversion if price approaches the prior peak region.
As of March 26, 2026, INFQ (Infleqtion Inc.) is in a bottoming attempt state on the daily chart with 64% confidence. Sharp rebound from a ~$8.8 swing low with 3 strong green candles, reclaiming the short-term EMA (~$11.1) and closing near ~$11.33 with improving momentum (RSI ~43.8).
On the daily timeframe, INFQ has key support at $9.60 and key resistance at $11.8. The most likely scenario (bullish) targets $11.8 and $12.8, with a revert level at $10.7.
INFQ (Infleqtion Inc.) is currently classified as bottoming attempt on the daily chart, with 64% confidence. Confirmation requires: Hold above $11.10 and then break/close above $11.80 (recent swing supply) for 2 sessions This would be invalidated by: Daily close back below $9.60 (loss of the rebound structure); stronger invalidation below $8.80
The most likely scenario (bullish) targets $11.8 and $12.8, with a revert level at $10.7. The alternative scenario (bearish) targets $10.0 and $8.80.
Multi-layer AI agents analyse 200+ stocks across daily, weekly, and monthly timeframes — producing market state classifications, price scenarios with targets, and position entry/exit levels. Updated every trading day after market close. No paywall. No sign-up required.
Built by Foliotrail.
All content on this website — including charts, analysis, price targets, support/resistance levels, and position zones — is generated entirely by AI and provided for educational and informational purposes only.
This is not financial advice. NEXUSNOIR VENTURES SL (the operator of this website) is not a registered investment adviser or broker-dealer. You should not make investment decisions based solely on this information. Always do your own research and consult a qualified financial advisor.
By continuing, you acknowledge that you have read and agree to our full disclaimer & terms of use and privacy policy.