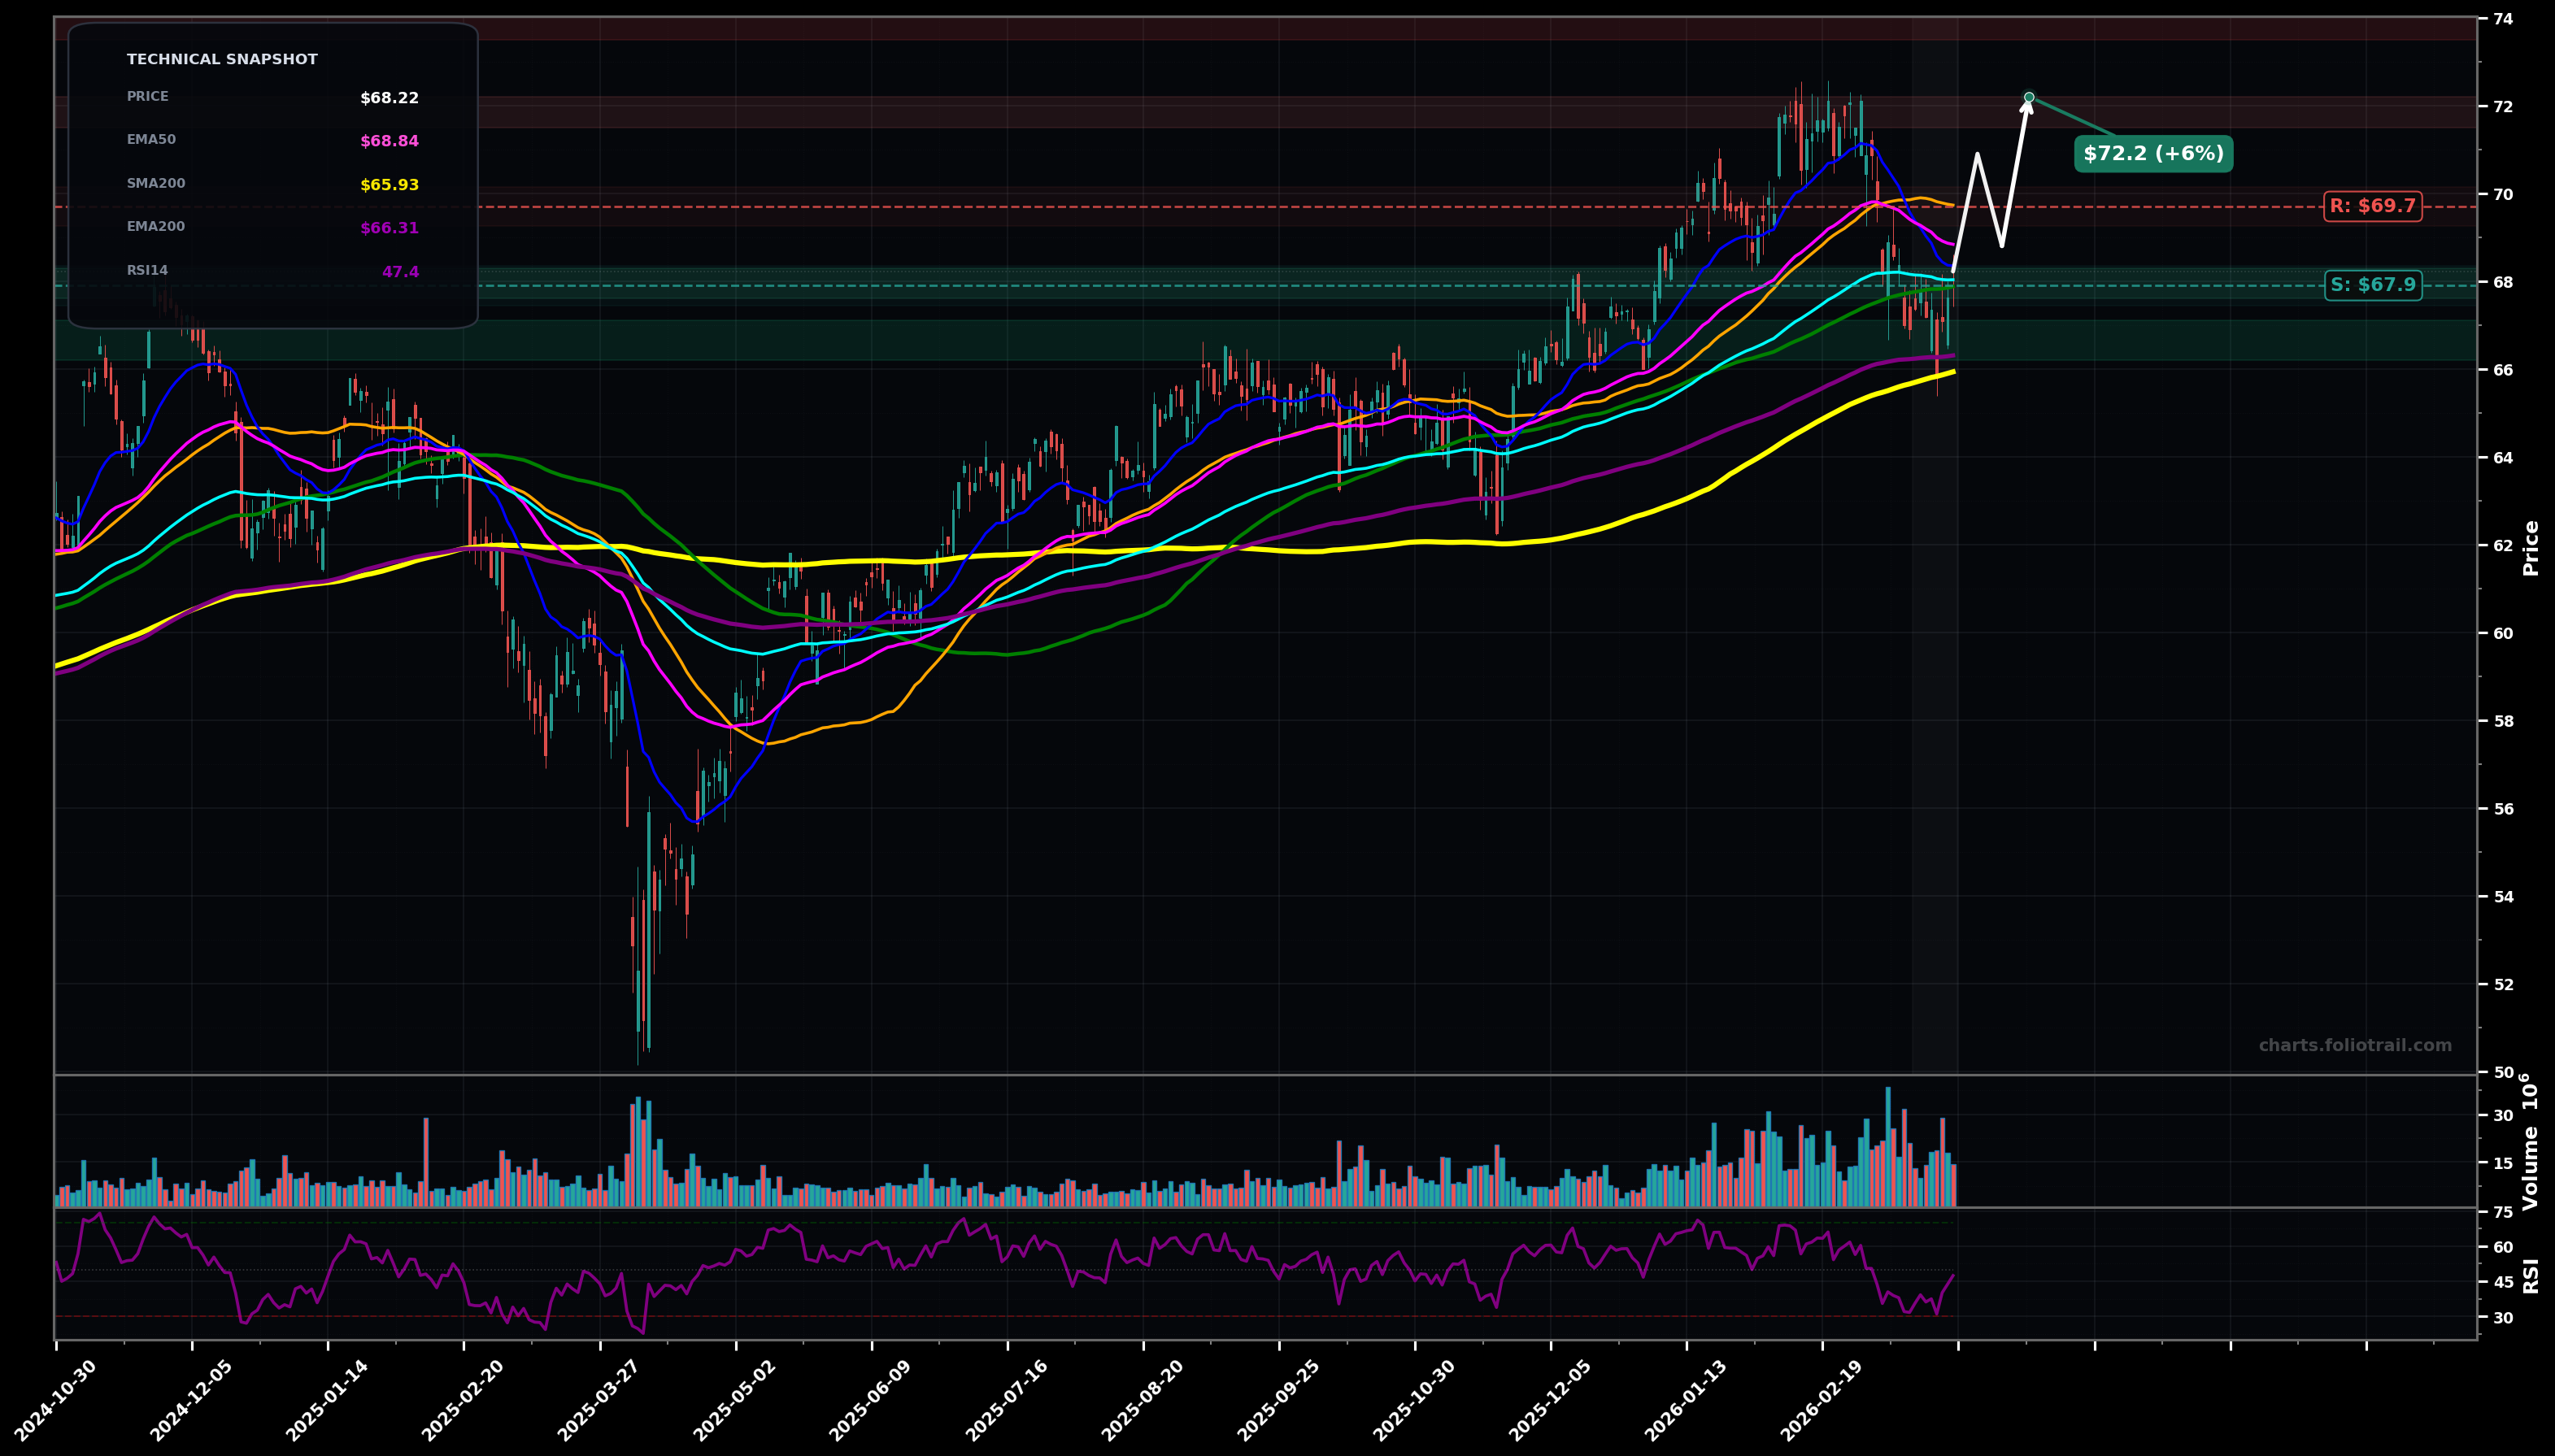
As of March 26, 2026, IJH (iShares Core S&P Mid-Cap ETF) is in a bottoming attempt state on the daily chart, with a confidence level of 62%. Key support is at $67.9 and key resistance at $69.7. Pullback from ~$72 swing high into a support cluster; price ~$68.22 sits below SMA50/100 and EMA50/100 but still above rising SMA200/EMA200.
Base forms above the $67–$68 cluster (EMA50/100 + SMA100) and price reclaims $69.7, setting up a retest of the recent distribution zone and eventually the prior high. Elliott: likely Wave (4) pullback completing, then Wave (5) attempt. Fib: expect reaction near the 38.2–50% pullback area of the last upswing, then continuation.
Breakdown through the $67 shelf turns the move into a deeper correction toward the long-term MAs (EMA200/SMA200). Elliott: Wave (4) extends/turns into ABC with C down. Fib: deeper mean-reversion toward ~61.8% of the last leg and/or the 200-day confluence.
2+ daily closes back above $69.73 (SMA50) with follow-through toward $70+
Daily close below $66.31 (EMA200) / $65.93 (SMA200) breaks the key trend floor
Buy interest is highest at the MA confluence first ($67–$68), then add on a controlled flush into EMA200/SMA200 ($66 area), with heavy adds only if price tags the long-term trend floor and stabilizes.
Trim into prior-high supply ($71.5–$72.2); increase trimming if a Wave (5) overshoots into an extension zone ($73.5–$75); fully exit only on a multi-year stretch/extension well above the MA stack ($76.5+).
As of March 26, 2026, IJH (iShares Core S&P Mid-Cap ETF) is in a bottoming attempt state on the daily chart with 62% confidence. Pullback from ~$72 swing high into a support cluster; price ~$68.22 sits below SMA50/100 and EMA50/100 but still above rising SMA200/EMA200.
On the daily timeframe, IJH has key support at $67.9 and key resistance at $69.7. The most likely scenario (bullish) targets $70.9 and $72.2, with a revert level at $68.8.
IJH (iShares Core S&P Mid-Cap ETF) is currently classified as bottoming attempt on the daily chart, with 62% confidence. Confirmation requires: 2+ daily closes back above $69.73 (SMA50) with follow-through toward $70+ This would be invalidated by: Daily close below $66.31 (EMA200) / $65.93 (SMA200) breaks the key trend floor
The most likely scenario (bullish) targets $70.9 and $72.2, with a revert level at $68.8. The alternative scenario (bearish) targets $66.3 and $65.9.
Multi-layer AI agents analyse 200+ stocks across daily, weekly, and monthly timeframes — producing market state classifications, price scenarios with targets, and position entry/exit levels. Updated every trading day after market close. No paywall. No sign-up required.
Built by Foliotrail.
All content on this website — including charts, analysis, price targets, support/resistance levels, and position zones — is generated entirely by AI and provided for educational and informational purposes only.
This is not financial advice. NEXUSNOIR VENTURES SL (the operator of this website) is not a registered investment adviser or broker-dealer. You should not make investment decisions based solely on this information. Always do your own research and consult a qualified financial advisor.
By continuing, you acknowledge that you have read and agree to our full disclaimer & terms of use and privacy policy.