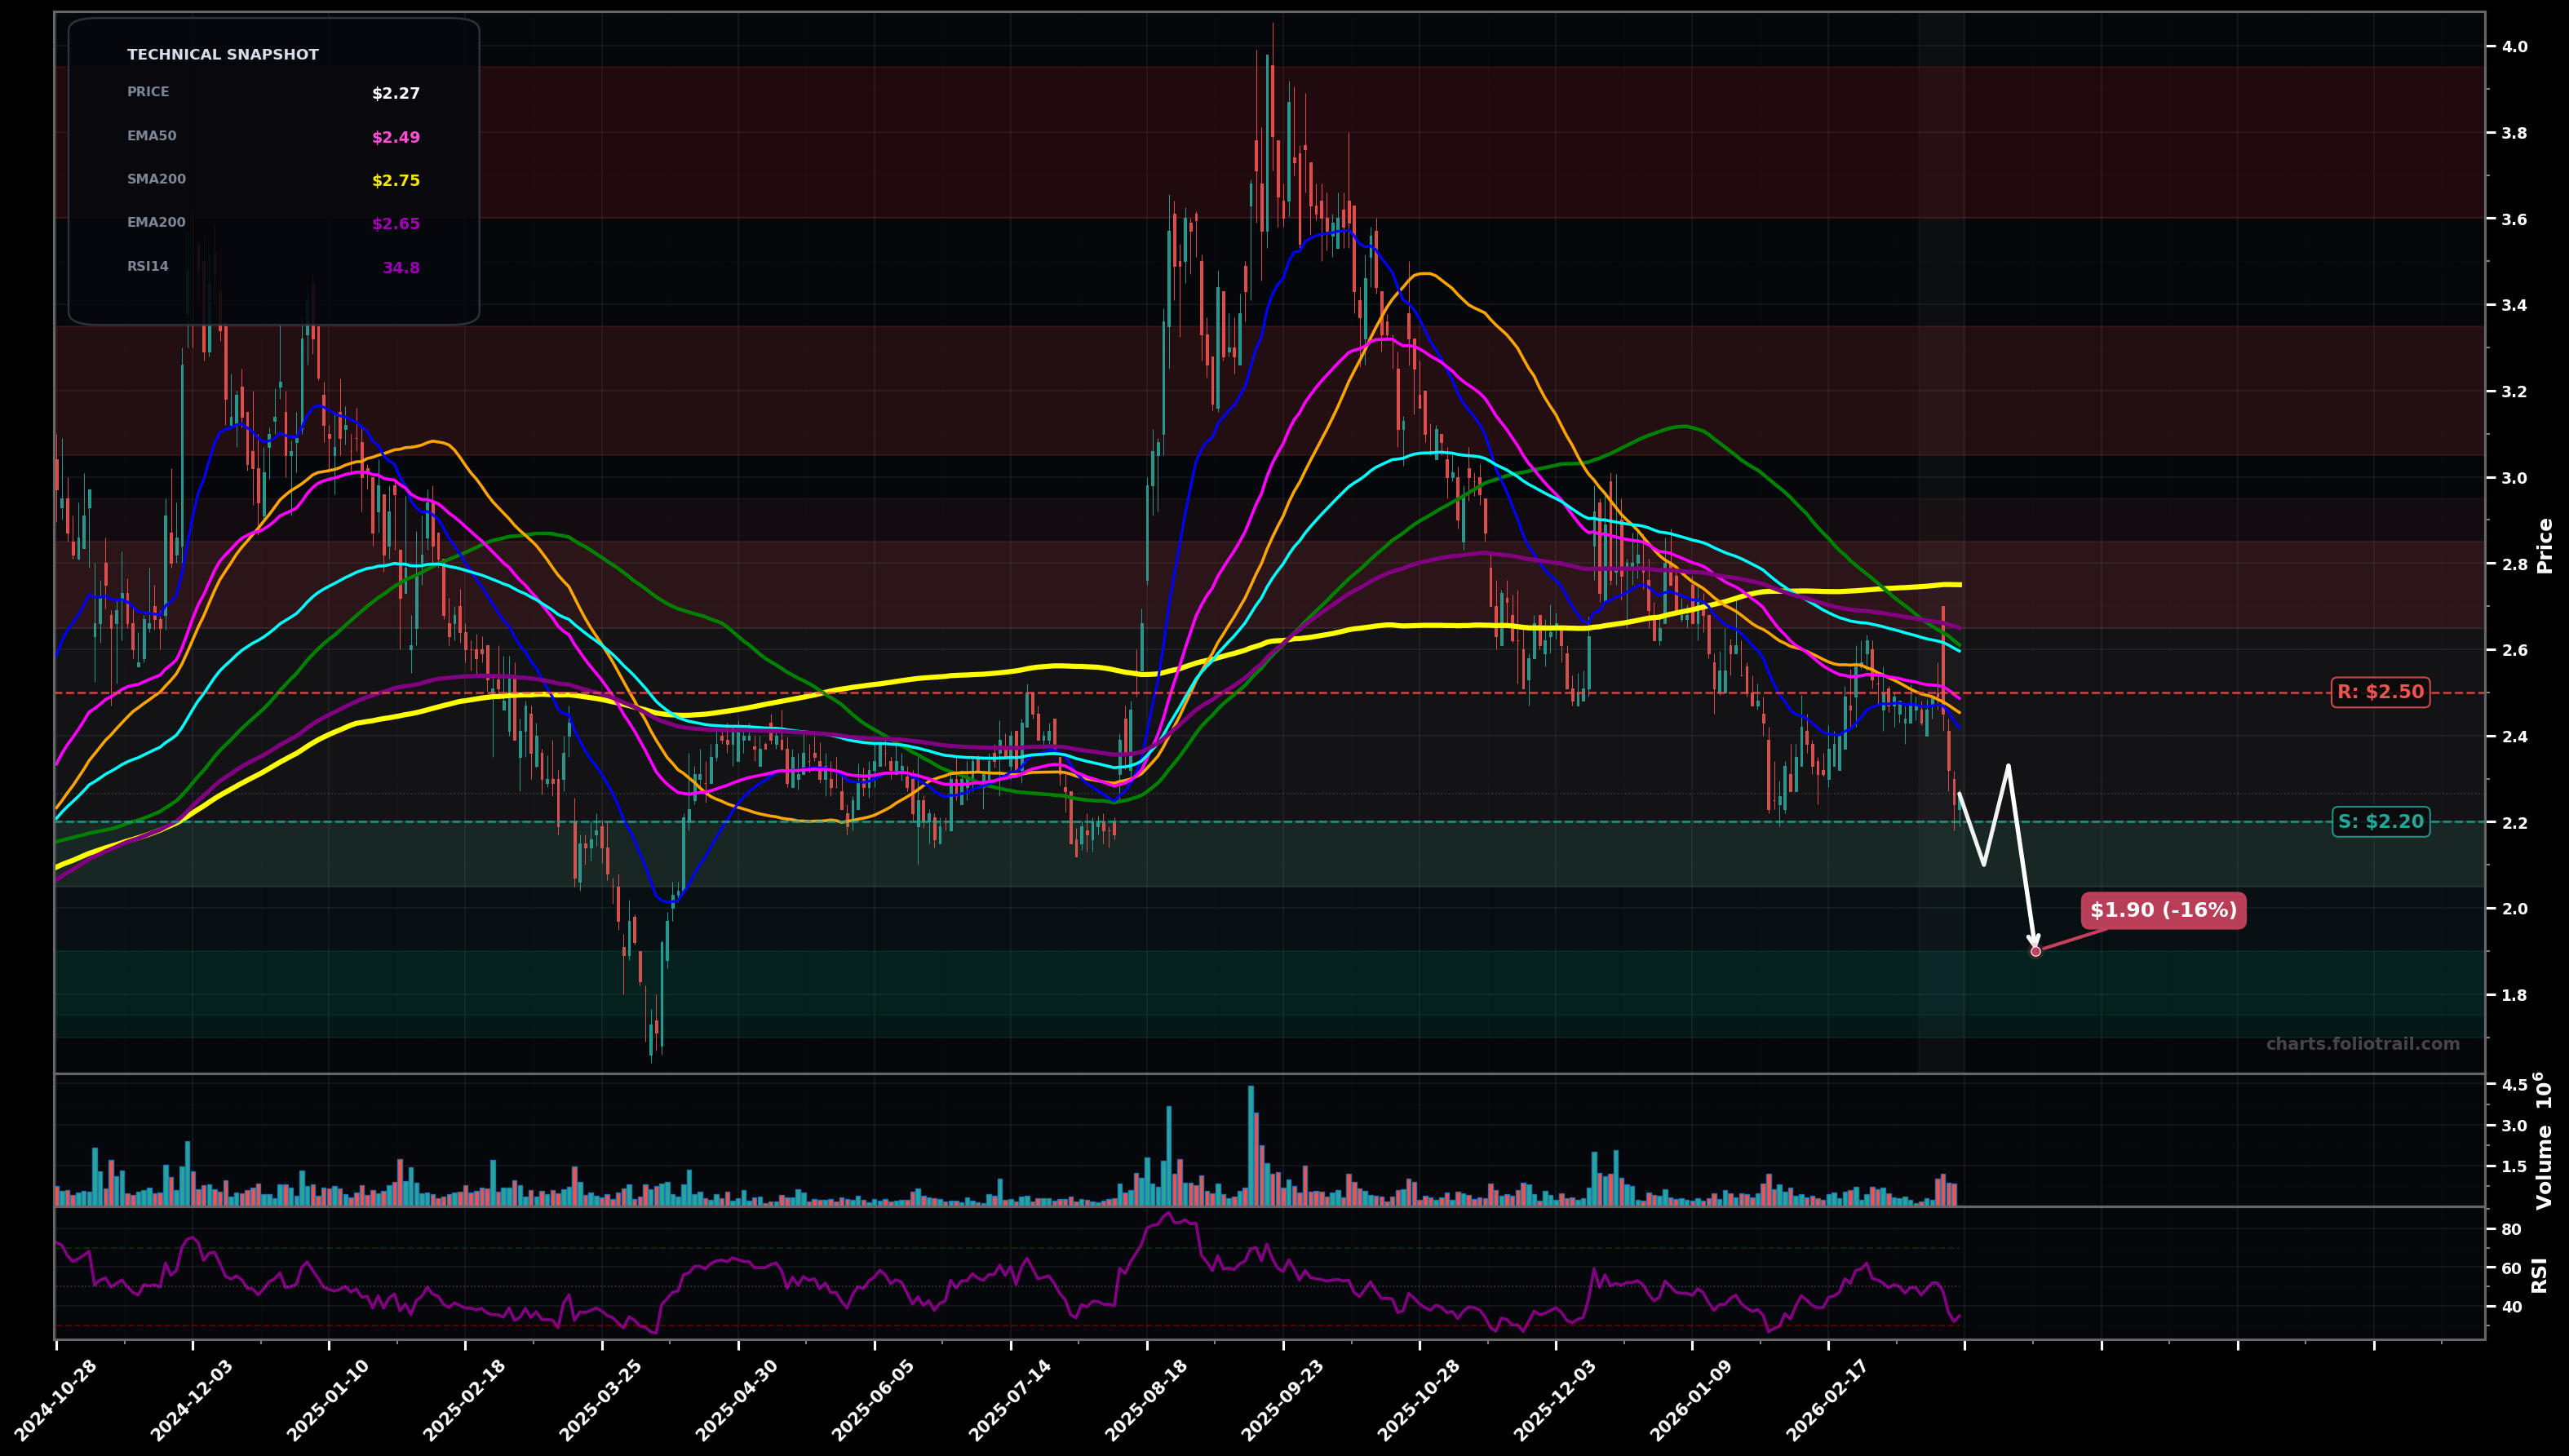
As of March 24, 2026, HITI (High Tide Inc.) is in a downtrend state on the daily chart, with a confidence level of 74%. Key support is at $2.20 and key resistance at $2.50. Price at ~$2.27 made a fresh swing breakdown under the ~$2.30–$2.35 area and is trading below EMA50/EMA100 with momentum weak (RSI ~35).
Bearish continuation: price chops briefly, then loses $2.20 and slides to the next demand area; likely part of an Elliott Wave C/5 down within the larger post-spike correction. (Prob ~60%)
Relief bounce / bottoming attempt: holds $2.20, forms a higher low, then mean-reverts into the MA cluster (EMA50/SMA50) and tests prior breakdown supply; fits an Elliott Wave corrective A-B-C up before trend decision. (Prob ~40%)
Daily close below $2.20 confirms continuation risk toward the next support band.
Two daily closes back above $2.50 would invalidate the immediate downtrend pressure (reclaim EMA50/SMA50 area).
Ladder bids into prior pivot-demand: $2.20 is the nearest swing-low reference; below it opens room to the next support shelf (~$1.9) and deeper flush zone (~$1.7) if a full capitulation leg prints.
Trim into overhead supply/MA congestion first ($2.65–$2.85), then larger derisk into the mid-range prior distribution ($3.05–$3.35); fully exit into the prior blow-off top zone ($3.6–$3.95) where reversal risk historically spikes.
As of March 24, 2026, HITI (High Tide Inc.) is in a downtrend state on the daily chart with 74% confidence. Price at ~$2.27 made a fresh swing breakdown under the ~$2.30–$2.35 area and is trading below EMA50/EMA100 with momentum weak (RSI ~35).
On the daily timeframe, HITI has key support at $2.20 and key resistance at $2.50. The most likely scenario (bearish) targets $2.10 and $1.90, with a revert level at $2.33.
HITI (High Tide Inc.) is currently classified as downtrend on the daily chart, with 74% confidence. Confirmation requires: Daily close below $2.20 confirms continuation risk toward the next support band. This would be invalidated by: Two daily closes back above $2.50 would invalidate the immediate downtrend pressure (reclaim EMA50/SMA50 area).
The most likely scenario (bearish) targets $2.10 and $1.90, with a revert level at $2.33. The alternative scenario (bullish) targets $2.45 and $2.65.
All content on this website — including charts, analysis, price targets, support/resistance levels, and position zones — is generated entirely by AI and provided for educational and informational purposes only.
This is not financial advice. NEXUSNOIR VENTURES SL (the operator of this website) is not a registered investment adviser or broker-dealer. You should not make investment decisions based solely on this information. Always do your own research and consult a qualified financial advisor.
By continuing, you acknowledge that you have read and agree to our full disclaimer & terms of use and privacy policy.