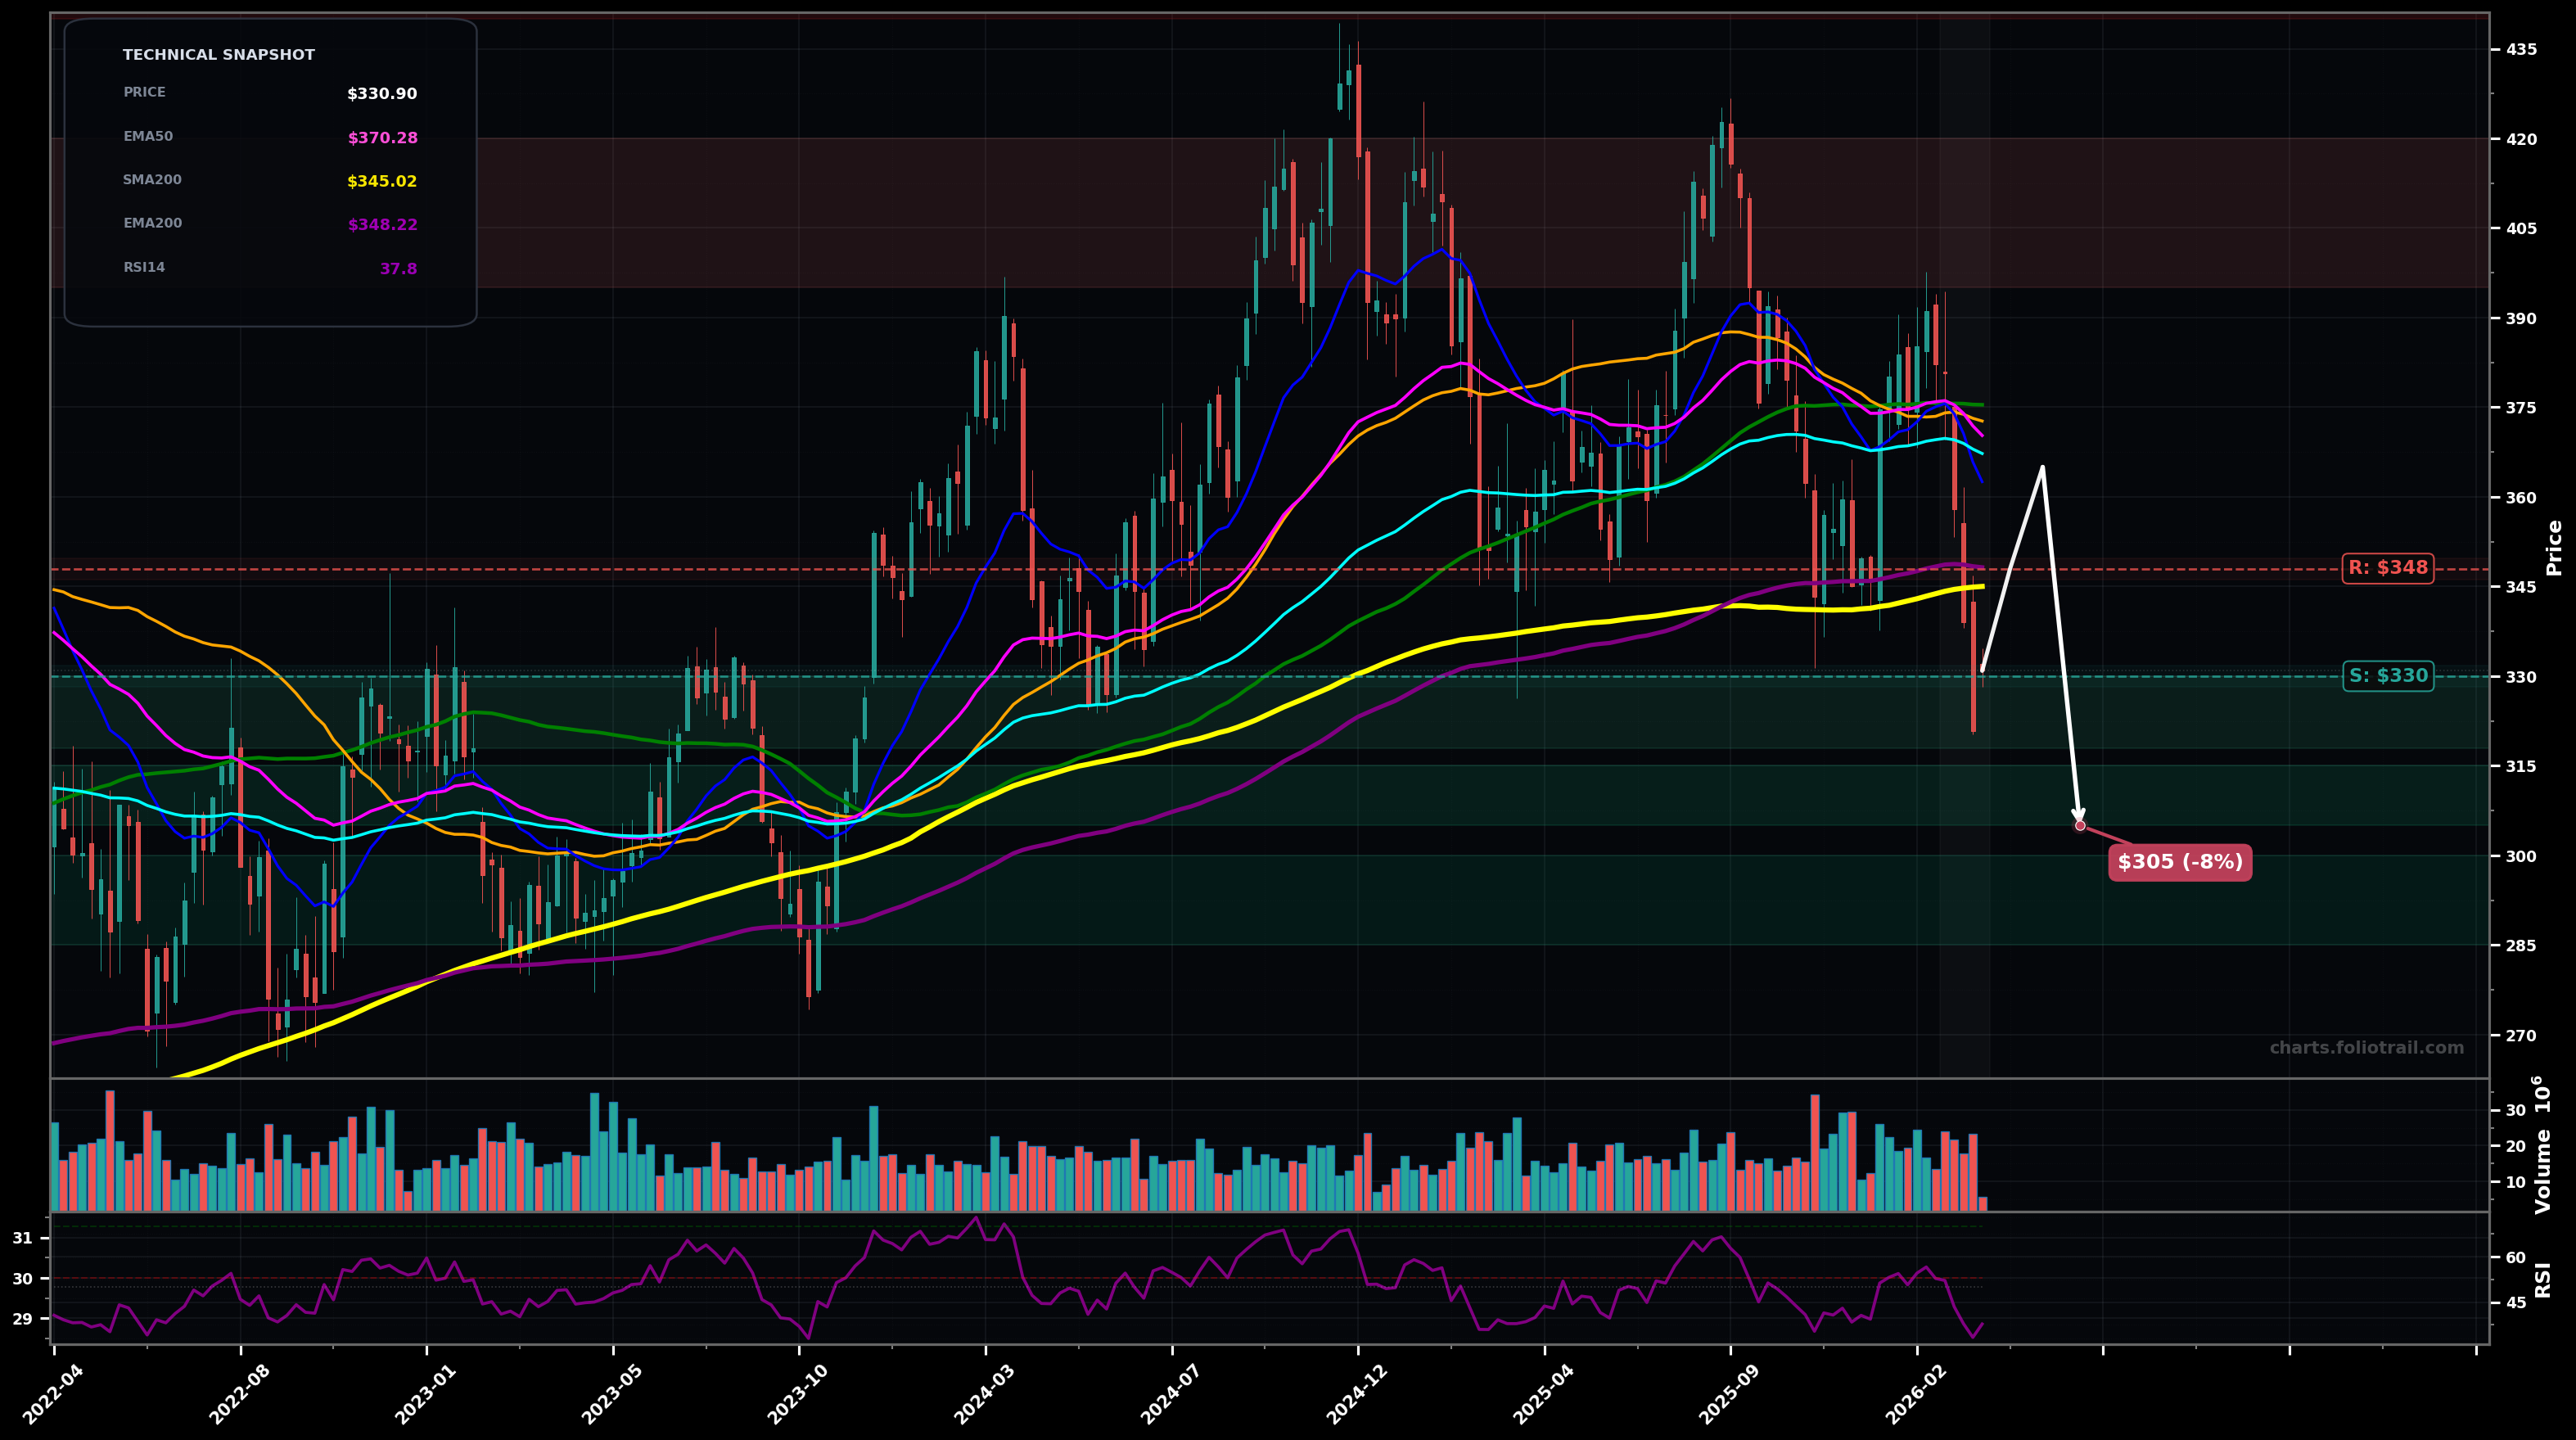
As of March 24, 2026, HD (The Home Depot, Inc.) is in a downtrend state on the weekly chart, with a confidence level of 72%. Key support is at $330 and key resistance at $348. Weekly selloff back below the fast MAs; price ($330.90) is under EMA50/EMA100 and under the rising long-term averages; RSI14 ~38 (weak momentum).
Mean-reversion bounce into the broken $345–$370 MA band, then rejection and another leg down (bear flag).
Bottoming attempt: hold $328–$330, build a base, then reclaim EMA50/EMA100 and rotate back toward prior range highs.
Confirm DOWNTREND on a weekly close below $328 (follow-through under the current swing area).
Invalidate if weekly closes reclaim and hold above $370 (EMA50) for 2+ weeks.
Scale at/just below the current swing-support ($330) then add into the next demand pockets ($305 and $285–$300) aligned with prior pivots + Fib-style retrace zones of the 2023–2024 advance; invalidated if the chart fails to stabilize and keeps printing LLs.
Trim into prior supply/major swing-high region ($395–$440) and consider full exit if price becomes extended above the long-term MA stack into new highs (typical Elliott Wave late-cycle / blow-off risk).
As of March 24, 2026, HD (The Home Depot, Inc.) is in a downtrend state on the weekly chart with 72% confidence. Weekly selloff back below the fast MAs; price ($330.90) is under EMA50/EMA100 and under the rising long-term averages; RSI14 ~38 (weak momentum).
On the weekly timeframe, HD has key support at $330 and key resistance at $348. The most likely scenario (bearish) targets $348 and $305, with a revert level at $365.
HD (The Home Depot, Inc.) is currently classified as downtrend on the weekly chart, with 72% confidence. Confirmation requires: Confirm DOWNTREND on a weekly close below $328 (follow-through under the current swing area). This would be invalidated by: Invalidate if weekly closes reclaim and hold above $370 (EMA50) for 2+ weeks.
The most likely scenario (bearish) targets $348 and $305, with a revert level at $365. The alternative scenario (bullish) targets $370 and $395.
All content on this website — including charts, analysis, price targets, support/resistance levels, and position zones — is generated entirely by AI and provided for educational and informational purposes only.
This is not financial advice. NEXUSNOIR VENTURES SL (the operator of this website) is not a registered investment adviser or broker-dealer. You should not make investment decisions based solely on this information. Always do your own research and consult a qualified financial advisor.
By continuing, you acknowledge that you have read and agree to our full disclaimer & terms of use and privacy policy.