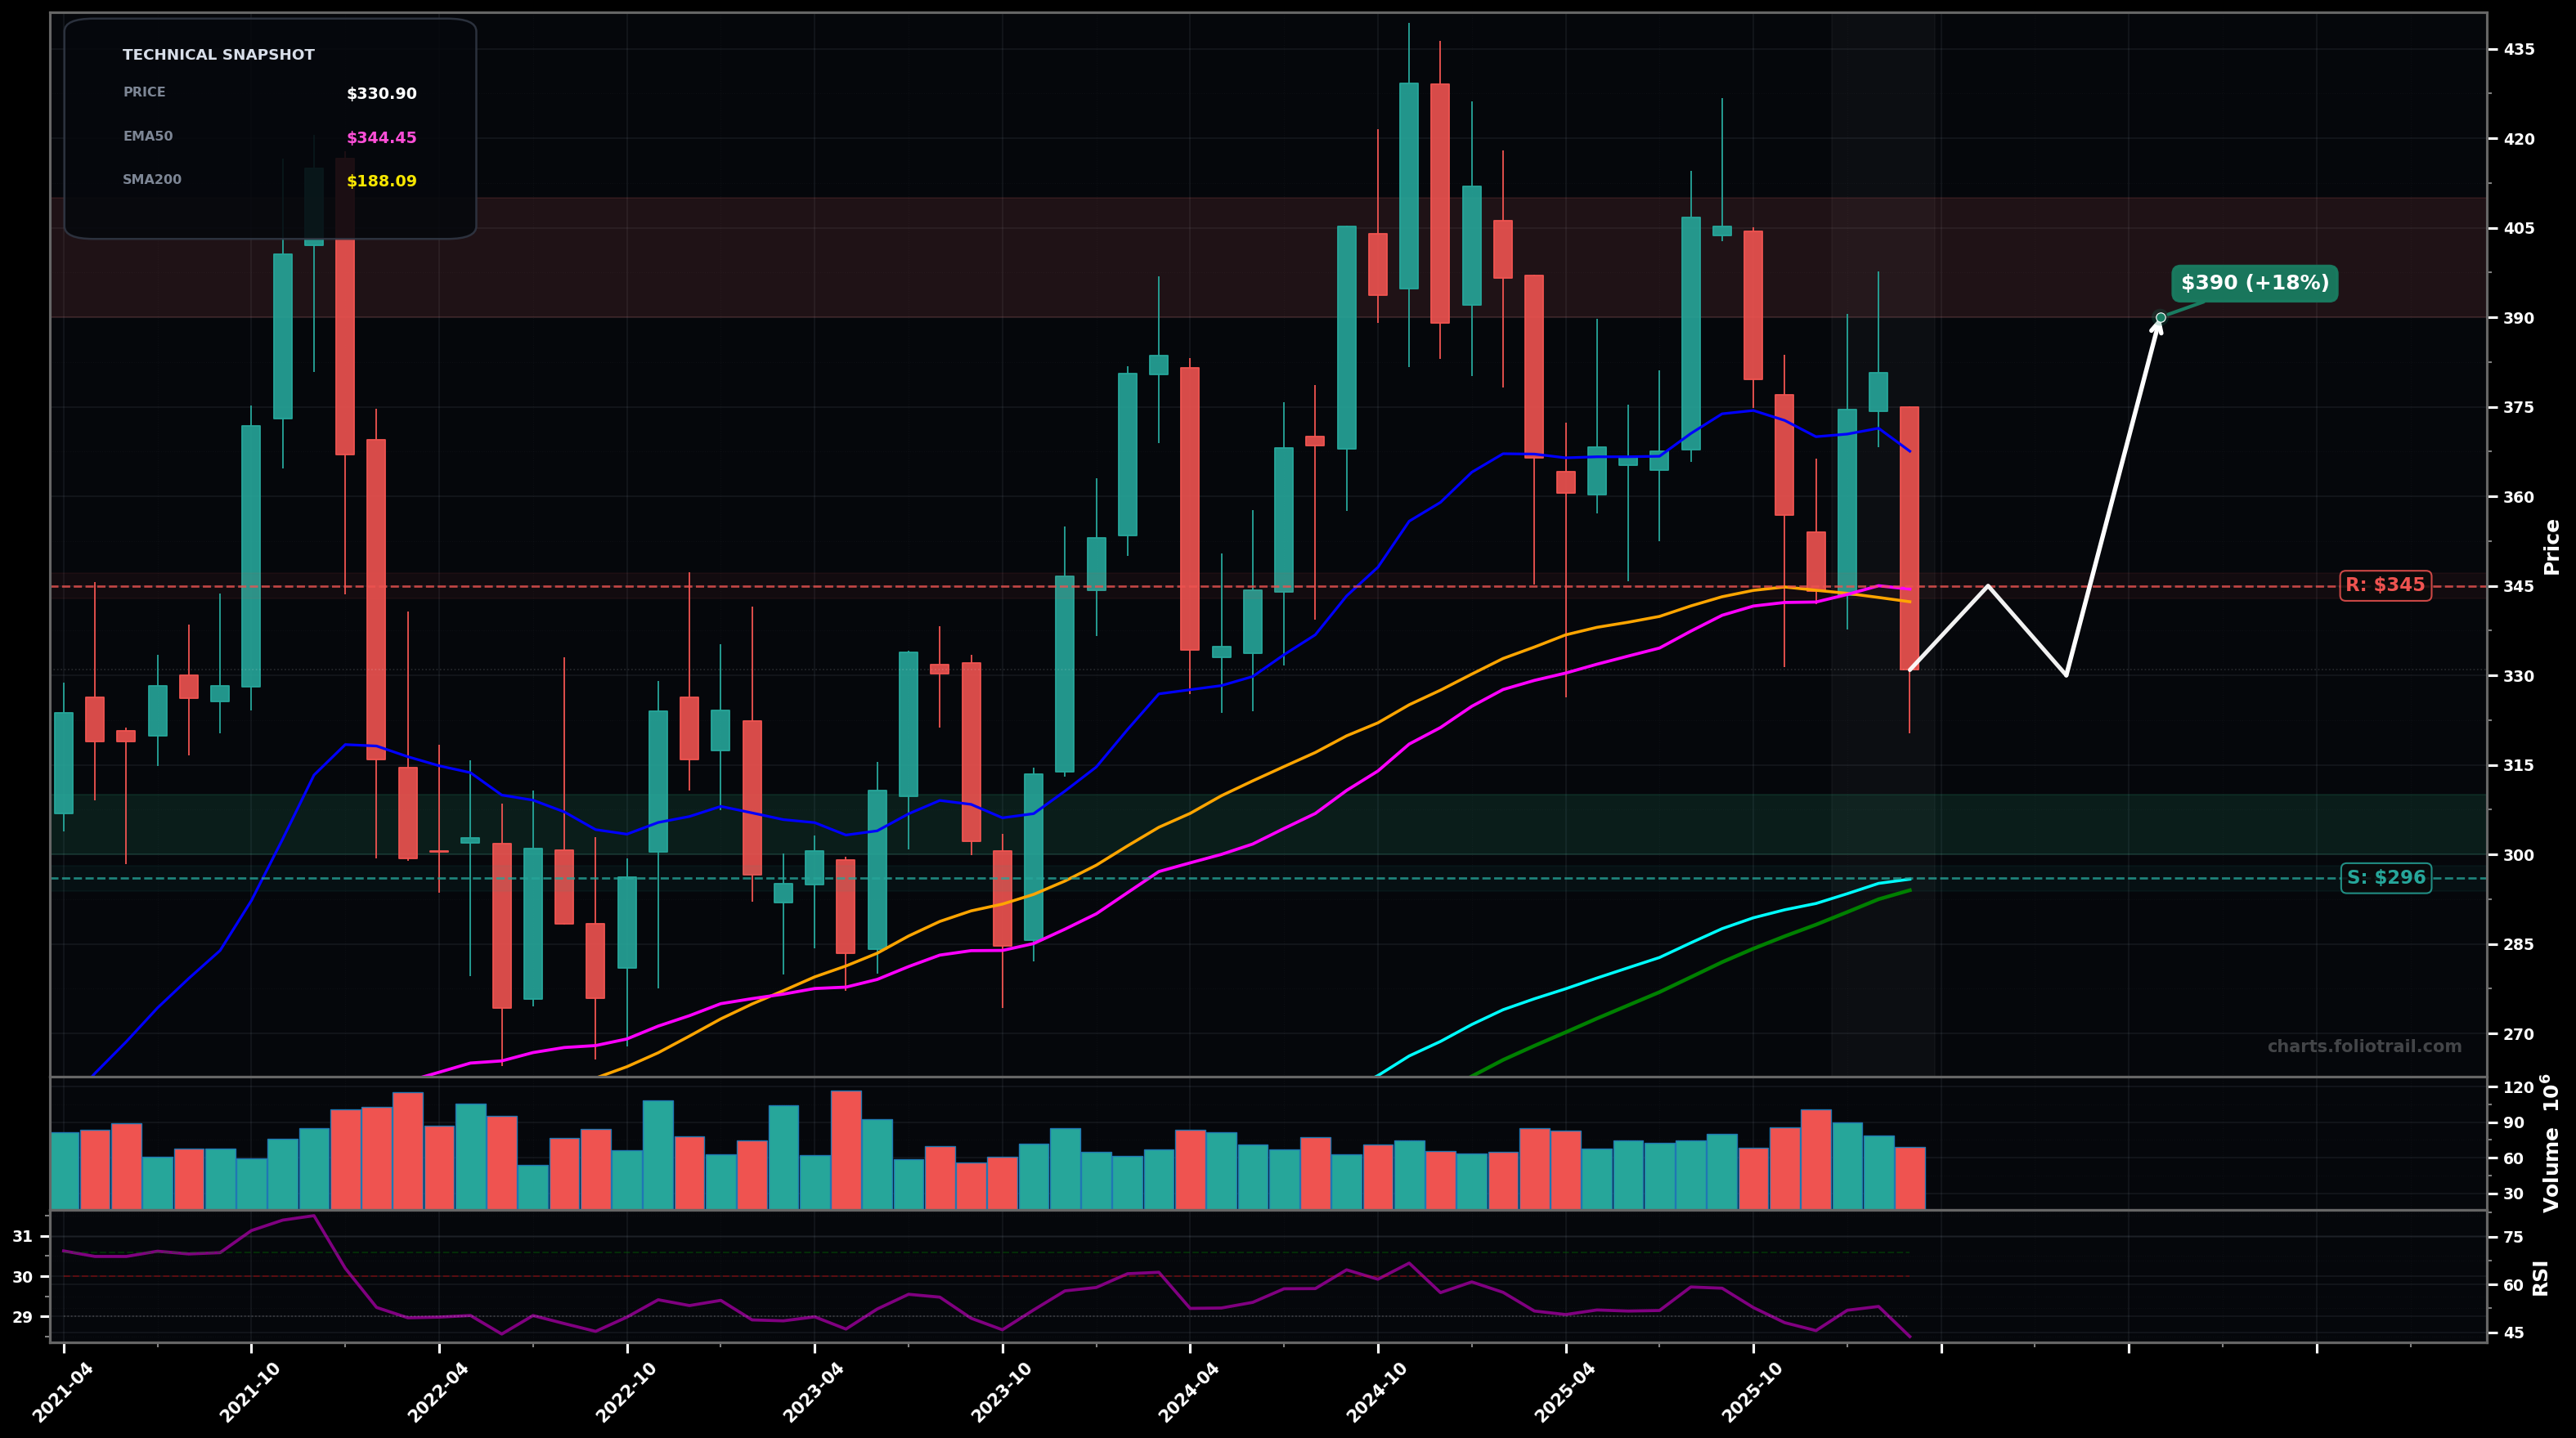
As of March 24, 2026, HD (The Home Depot, Inc.) is in a bottoming attempt state on the monthly chart, with a confidence level of 58%. Key support is at $296 and key resistance at $345. Monthly selloff back under the fast MAs; last candle is a strong red push into the $330s with RSI ~44, rejecting the prior bounce area.
Base-building above the $296 (EMA100) area, then a reclaim of $345 leads to a mean-reversion rally toward prior supply.
Failure to reclaim $345 and continued weakness breaks $296 (EMA100), triggering a deeper ABC correction toward the higher-timeframe MA cluster.
2+ monthly closes back above $345 (reclaim EMA50 pink / SMA50 orange) would confirm a breakout-reversal attempt.
A monthly close below $296 (EMA100 cyan) would invalidate the bottoming-attempt and shift bias to DOWNTREND/FALLING_KNIFE risk.
Start near EMA100 cyan support ($296) for a higher-low attempt; add on deeper pullback toward prior pivot/mean-reversion; heavy add only near EMA200 purple (~$223) where long-term trend support typically defends.
Trim into prior swing-supply ($390-$435) where rallies have failed; close only if a future extension becomes materially stretched well above the MA stack and prior ATH zone (blow-off risk).
As of March 24, 2026, HD (The Home Depot, Inc.) is in a bottoming attempt state on the monthly chart with 58% confidence. Monthly selloff back under the fast MAs; last candle is a strong red push into the $330s with RSI ~44, rejecting the prior bounce area.
On the monthly timeframe, HD has key support at $296 and key resistance at $345. The most likely scenario (bullish) targets $345 and $390, with a revert level at $330.
HD (The Home Depot, Inc.) is currently classified as bottoming attempt on the monthly chart, with 58% confidence. Confirmation requires: 2+ monthly closes back above $345 (reclaim EMA50 pink / SMA50 orange) would confirm a breakout-reversal attempt. This would be invalidated by: A monthly close below $296 (EMA100 cyan) would invalidate the bottoming-attempt and shift bias to DOWNTREND/FALLING_KNIFE risk.
The most likely scenario (bullish) targets $345 and $390, with a revert level at $330. The alternative scenario (bearish) targets $296 and $223.
All content on this website — including charts, analysis, price targets, support/resistance levels, and position zones — is generated entirely by AI and provided for educational and informational purposes only.
This is not financial advice. NEXUSNOIR VENTURES SL (the operator of this website) is not a registered investment adviser or broker-dealer. You should not make investment decisions based solely on this information. Always do your own research and consult a qualified financial advisor.
By continuing, you acknowledge that you have read and agree to our full disclaimer & terms of use and privacy policy.